Market Overview
September was another eventful month for the financial markets and was in fact the worst performing month of 2023 in US equities.
As expressed in our prior newsletter, September is historically a tough month for equities. This was no exception. Throughout September, the SPY posted a return of -5.1% and the YTD is +11.7%. The Nasdaq Composite performed -5.8% (YTD of +27.1%). Technology stocks were hit particularly hard, such as Apple -8.9% and Nvidia -12%. Major overseas stock benchmarks also declined for the month. The Stoxx Europe 600 fell -1.7% in September, while Japan’s Nikkei 225 dropped -2.3% and Hong Kong’s Hang Seng retreated -3.1%.
Inflation and interest rates persisted as the dominant themes influencing market activity. Key in this monthly market performance was the Federal Reserve meeting on September 19 and 20. Investors are realizing that the Fed plans to keep its interest rate higher for a longer period of time than it had expected. The next meeting will be in November and there seems to be no clear market direction until such time. Additionally, the 10 year Treasuries broke the 4.5% “ceiling” (now yielding around 4.58%).
As the treasury market was hit both the Dollar and Oil appreciated significantly adding extra pressure to the FED’s inflation target. Moreover, a stronger US dollar and higher energy prices are challenging for US multinational profit margins. They are also headwinds for emerging markets (i.e. oil importers and US dollar bond issuers) which are part of the 2024 strong market thesis.
Performance
During September the Fund’s preliminary net return was -1.5%, bringing our YTD net performance to +11.45%.
We are very comfortable with the performance of our model and the enhancements which were put in place during September. Once again the model demonstrated its resilience to substantial market fluctuations, a 3 standard deviation movement in June-July and a market drop of more than -8% from July’s peak, while maintaining a robust risk management.
Teks Alpha Performance (%)
| JAN | FEB | MAR | APR | MAY | JUN | JUL | AUG | SEP | OCT | NOV | DEC | YTD | |
|---|---|---|---|---|---|---|---|---|---|---|---|---|---|
| 2021 | — | — | 1.36 | 0.79 | 0.77 | 0.80 | 1.51 | 1.61 | 1.15 | 2.56 | 1.70 | — | 12.9 |
| 2022 | -0.65 | 1.22 | 1.22 | -0.10 | -1.85 | -5.7 | 2.35 | -1.61 | -0.5 | 0.33 | —3.1 | —0.7 | -9.0 |
| 2023 | 3.5 | 0.45 | 1.45 | 2.20 | 5.20 | -1.50 | 0.2 | 1.10 | -1.50 | — | — | — | 11.4 |
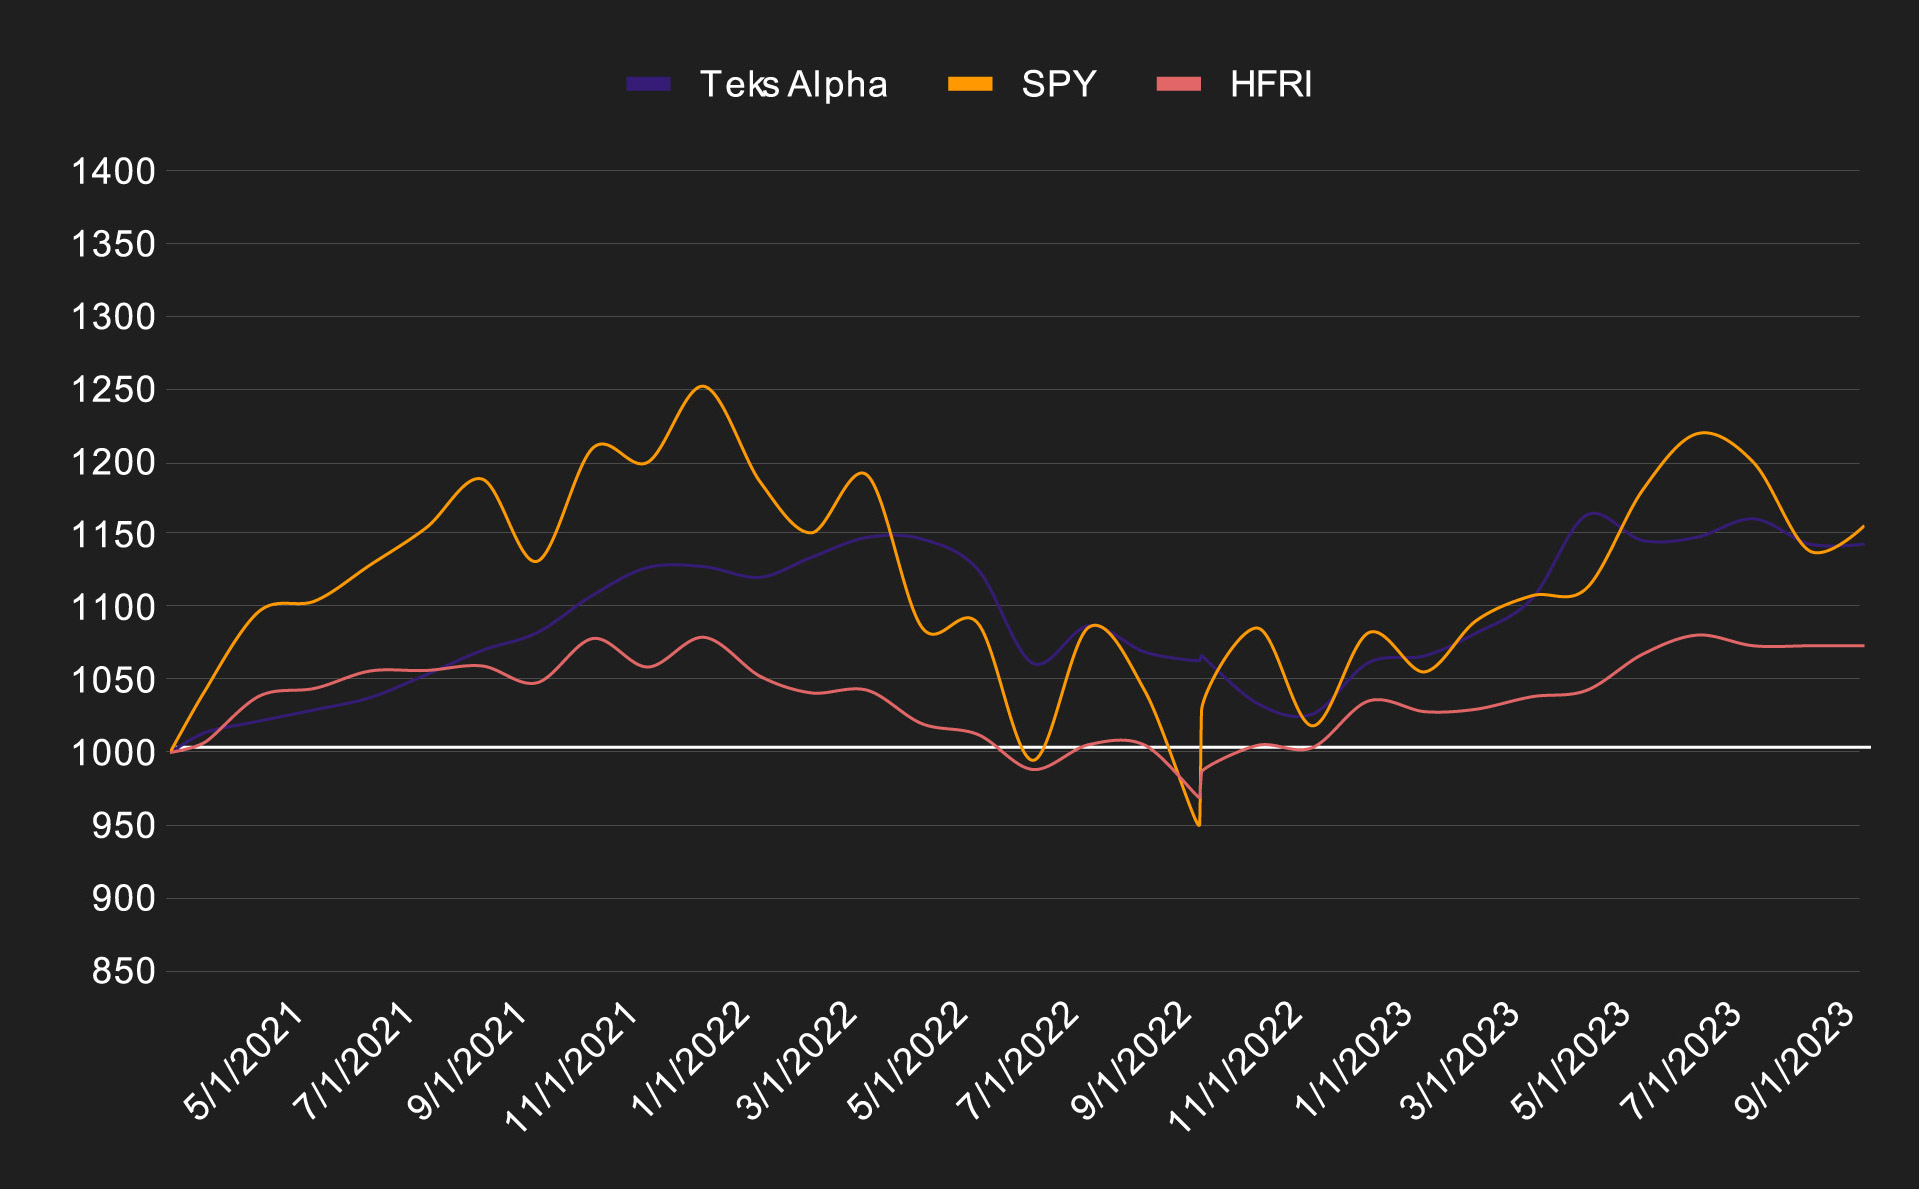
Teks Alpha Performance vs Benchmarks since inception (March 2021)
| TEKS ALPHA | SPY | HFRI | |
|---|---|---|---|
| Effective | 14.34% | 13.87% | 7.01% |
| Annualized | 5.80% | 5.60% | 2.83% |
| STD Dev | 7.00% | 17.82% | 5.93% |
| Shape Ratio | 0.44 | 0.16 | 0.01 |