Market Overview
May was another eventful month for the financial markets, as the Federal Reserve oscillated between potential rate hikes and cuts. The dialogue surrounding the US debt ceiling further fueled volatility, adding uncertainty over the market's direction.
The Fed's next scheduled meeting is scheduled for mid-June, with a possible 25 basis point increase being anticipated. However, in general, economists do not have full conviction regarding additional rate hikes in the future or market performance. Most of them see the market range bound.
Throughout May the SPY posted a +0.5% gain (YTD +9.2%), while the Nasdaq Composite performed +7.3% (YTD +29.7%). Needless to point out, technology stocks were the star performers.
Inflation and interest rates remained the key themes impacting market activity, coupled with the debt ceiling discussions and speculation over whether the US market is poised for a soft landing or a full-blown recession.
As we transition into July, both investors and market participants will be keenly scrutinizing the Federal Reserve's forthcoming policy decisions and economic indicators.
Performance
During May the Fund’s net return was +5.2%. This brings the YTD net performance to +13.3%.
We have achieved these returns by gradually switching in February 2023 from digital to traditional assets, i.e. options over US equities. This performance delivered a +3.4 sharpe ratio.
The results of deploying our model on the SPY in our personal account (where we test all trades before executing them in the Fund), are even more impressive. We obtained a +82% total return since December 2022, compared to a +2.5% return of the SPY during the same time period.
We are currently working on new structures and enhancements to our model, with the goal of being mostly market neutral. We are prioritizing stability, and consistent/solid performance, regardless of market conditions.
We are confident that these enhancements will further improve our already solid track record and will deliver outstanding returns. We are also fully committed to exceptional risk management as we grow our assets and team.
Teks Alpha Performance (%)
| JAN | FEB | MAR | APR | MAY | JUN | JUL | AUG | SEP | OCT | NOV | DEC | YTD | |
|---|---|---|---|---|---|---|---|---|---|---|---|---|---|
| 2021 | — | — | 1.36 | 0.79 | 0.77 | 0.80 | 1.51 | 1.61 | 1.15 | 2.56 | 1.70 | — | 12.9 |
| 2022 | -0.65 | 1.22 | 1.22 | -0.10 | -1.85 | -5.7 | 2.35 | -1.61 | -0.5 | 0.33 | —3.1 | —0.7 | -9.0 |
| 2023 | 3.5 | 0.45 | 1.45 | 2.20 | 5.20 | — | — | — | — | — | — | — | 13.3 |
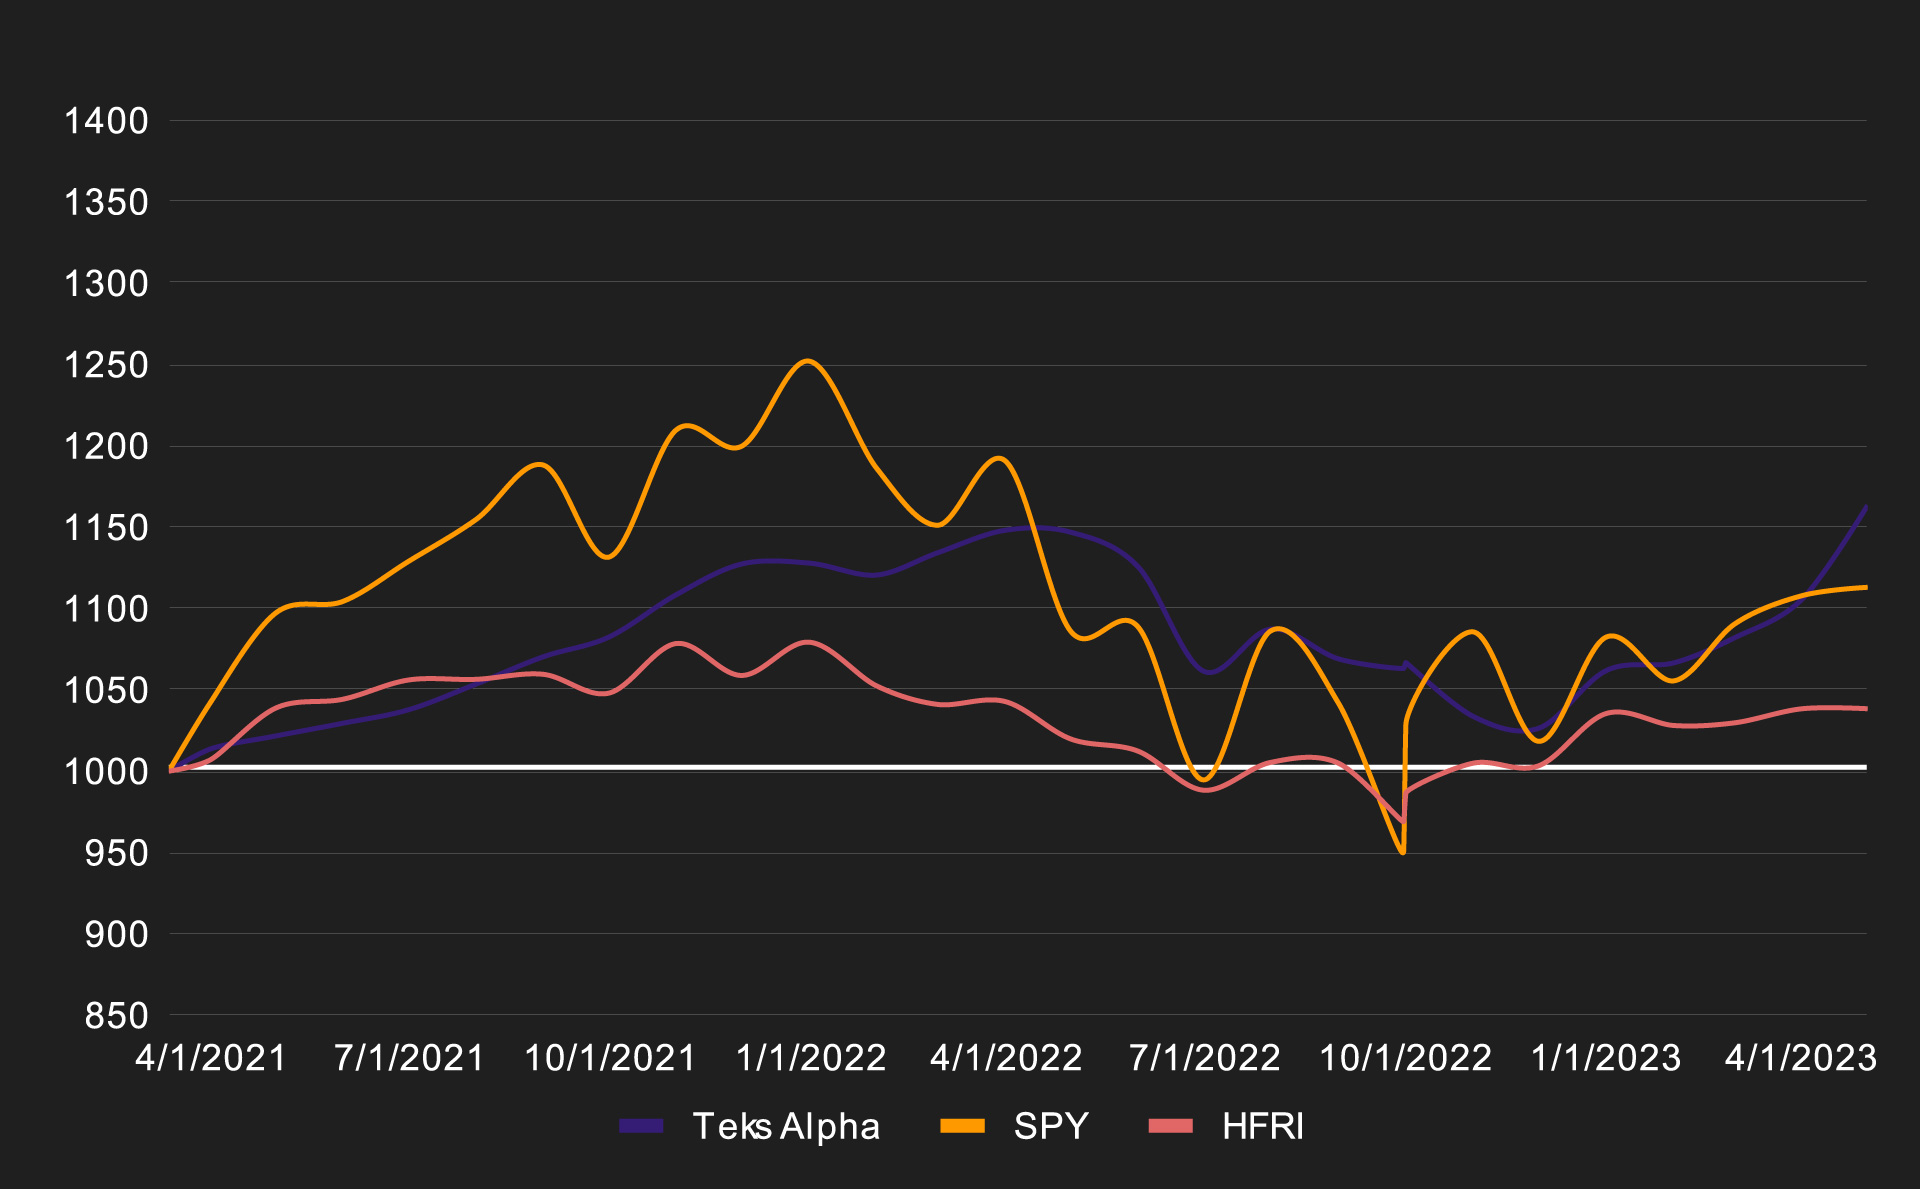
Teks Alpha Performance vs Benchmarks since inception (March 2021)
| TEKS ALPHA | SPY | HFRI | |
|---|---|---|---|
| Effective | 16.33% | 11.30% | 3.84% |
| Annualized | 7.64% | 5.29% | 1.80% |
| STD Dev | 7.25% | 18.22% | 6.09% |
| Shape Ratio | 0.67 | 0.14 | -0.16 |