Market Overview
In March, the term “March Madness” appeared more fitting for the wild financial market performance rather than the annual College National Basketball Tournament.
Throughout the month, expectations about the next Federal Reserve’s policy decision changed in a wild manner. At the beginning of the month, it was obvious that the Fed would keep rising interest rates to fight rising inflation. But then, with the second largest bank failure in US history (Silicon Valley Bank) and the subsequent collapse of both Silvergate and Signature Bank, market predictions shifted towards potential rate cuts. On top of this turmoil, the failure of a major European Bank, Credit Suisse, fueled uncertainty and fear of a global contagion.
Upside and downside swings of 10% were not uncommon. During the month the SPY posted a +3.5% (YTD +7%) with Apple and MSFT accounting for at least half of that gain. Meanwhile, the Nasdaq Composite performed +6.7% (YTD +16.8%).
The key themes still remain inflation and interest rates and whether the US market will experience a soft landing instead of a recession. The bond yield curve remains inverted, this is shorter maturities pay now more than longer ones, however to a lower extent than earlier in the month. Historically, this has indicated an impending recession, as investors anticipate future rate cuts.
The upcoming Fed meeting on May 2nd and 3rd could result in a 25 basis point increase. Data in the coming month should provide insights about such a decision.
In the case of Bonds and Gold, March was a very positive month as they performed +4.7% (+7.25% YTD) and +6.1% (6.4 % YTD), respectively.
Bitcoin and the broader crypto market traded up aggressively during March, despite the banking problems. This is surprising, as USDC depegged against the US$, after Circle (the Company behind USD), expressed they had almost 8% of its 40 billion US$ in reserves at SVB. Furthermore, Binance and its CEO were also sued by the US Commodities Futures Trading Commission for alleged trading violations.
During the month, BTC and ETH ended up performing almost +25% (+70% YTD) and around +14% (+50% YTD). Needs to be pointed out, however, that the one year return for BTC is around -40% and for ETH is -48%.
Performance
During March, the Fund net return was +1.45%. This brings the 1st quarter net performance to +5.4%.
It needs to be said that this performance was achieved with much lower volatility than the underlying asset class, the S&P 500. For example consider the difference in drawdowns: while the S&P 500 experienced a maximum price decline of -10% from February to March, the Fund’s drawdown remained below -1.7%
The results of deploying our model on the SPY are indeed very impressive. In our personal account (where we test all trades before executing them in the Fund), we had a +49.7% total return since December 2022, compared to a +1% return of the SPY during the same time period.
Going forward, we plan to keep up to 10% invested in digital assets via structured products, with a long bias in both BTC and ETH. The remaining 90% is invested in our option prop model with exposure to the SPY
Teks Alpha Performance (%)
| JAN | FEB | MAR | APR | MAY | JUN | JUL | AUG | SEP | OCT | NOV | DEC | YTD | |
|---|---|---|---|---|---|---|---|---|---|---|---|---|---|
| 2021 | — | — | 1.36 | 0.79 | 0.77 | 0.80 | 1.51 | 1.61 | 1.15 | 2.56 | 1.70 | — | 12.9 |
| 2022 | -0.65 | 1.22 | 1.22 | -0.10 | -1.85 | -5.7 | 2.35 | -1.61 | -0.5 | 0.33 | —3.1 | —0.7 | -9.0 |
| 2023 | 3.5 | 0.45 | 1.45 | — | — | — | — | — | — | — | — | — | 5.4 |
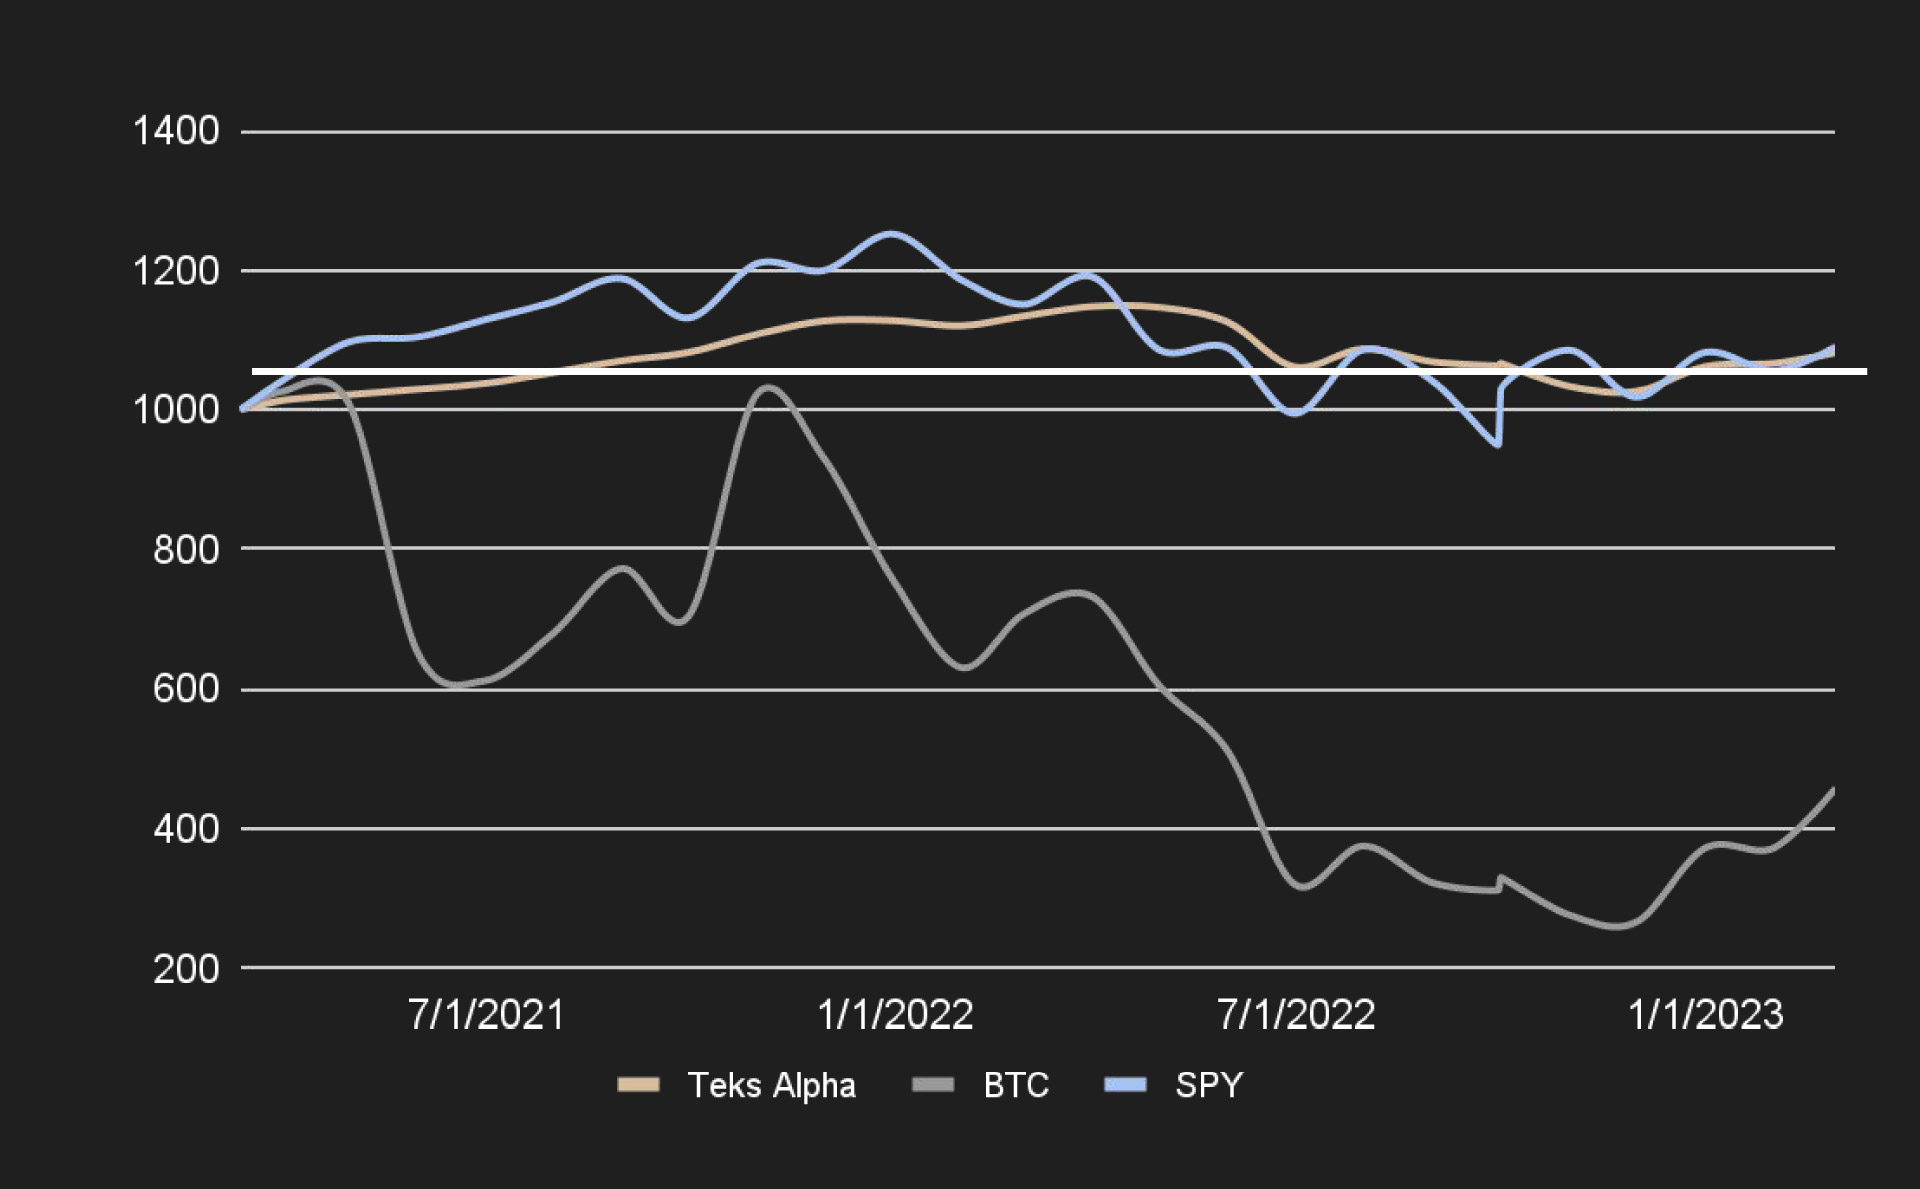
Teks Alpha Performance vs Benchmarks since inception (March 2021)
| TEKS A | BTC | SPY | |
|---|---|---|---|
| Effective | 8.20% | -54.20% | 9.05% |
| Annualized | 4.16% | -27.51% | 4.59% |
| STD Dev | 6.65% | 68.70% | 18.95% |
| Shape Ratio | 0.21 | -0.44 | 0.10 |