Market Overview
In July the prevailing market sentiment was distinctly favorable, underscored by a notable reduction in inflation within developed markets and steadfast GDP statistics. These dynamics provided confidence in a gradual economic stabilization, leading to comprehensive appreciation across diverse asset classes and regions.
The Federal Reserve increased its principal policy rate by 25 basis points (bps), elevating the federal funds rate to a range of 5.25%-5.50%, consistent with market anticipations. The verbiage of the Federal Open Market Committee's proclamation remained largely unaltered from its previous gathering, preserving the term “additional policy firming may be appropriate”.
The SPY showcased a robust growth of +3.2% recording a YTD of +21.9%, the Nasdaq Composite performed +3.86% (YTD +35.5%), its best first half-year performance since 1983.
Beyond the realm of AI-centric equities, the market performance appears subdued. This can be interpreted in a dual manner: either the increasing concentration of returns signifies heightened risk, or the majority of stocks, having not shared in the gains, possess latent potential for growth. Our perspective largely resonates with the former supposition.
We believe that the risk is escalating due to the limited market diversity and looming economic challenges.
Performance
During July the Fund’s preliminary net return was +0.2%, bringing the YTD net performance to +11.87%.
In July, there was a strategic reshuffling of the portfolio, enhancing its outlook for the latter half of the year. Adopting a market-neutral stance posed challenges, especially when markets deviated by 3 standard deviations. However, this proved beneficial, enabling our models to refine at a minimal cost and bolster the resilience of our strategy.
We are confident that the recent portfolio repositioning will yield favorable results in the upcoming months. Given the aggressive market fluctuations observed over the past two months, we are intensifying our efforts to hedge against tail risk. As we undertake this, we exercise utmost caution to ensure that the potential profitability of the portfolio remains unaffected.
We remain committed to our objective of producing a net monthly return of +3% to +4% over a sustained period, factoring in the implications of time decay.
Teks Alpha Performance (%)
| JAN | FEB | MAR | APR | MAY | JUN | JUL | AUG | SEP | OCT | NOV | DEC | YTD | |
|---|---|---|---|---|---|---|---|---|---|---|---|---|---|
| 2021 | — | — | 1.36 | 0.79 | 0.77 | 0.80 | 1.51 | 1.61 | 1.15 | 2.56 | 1.70 | — | 12.9 |
| 2022 | -0.65 | 1.22 | 1.22 | -0.10 | -1.85 | -5.7 | 2.35 | -1.61 | -0.5 | 0.33 | —3.1 | —0.7 | -9.0 |
| 2023 | 3.5 | 0.45 | 1.45 | 2.20 | 5.20 | -1.50 | 0.2 | — | — | — | — | — | 11.87 |
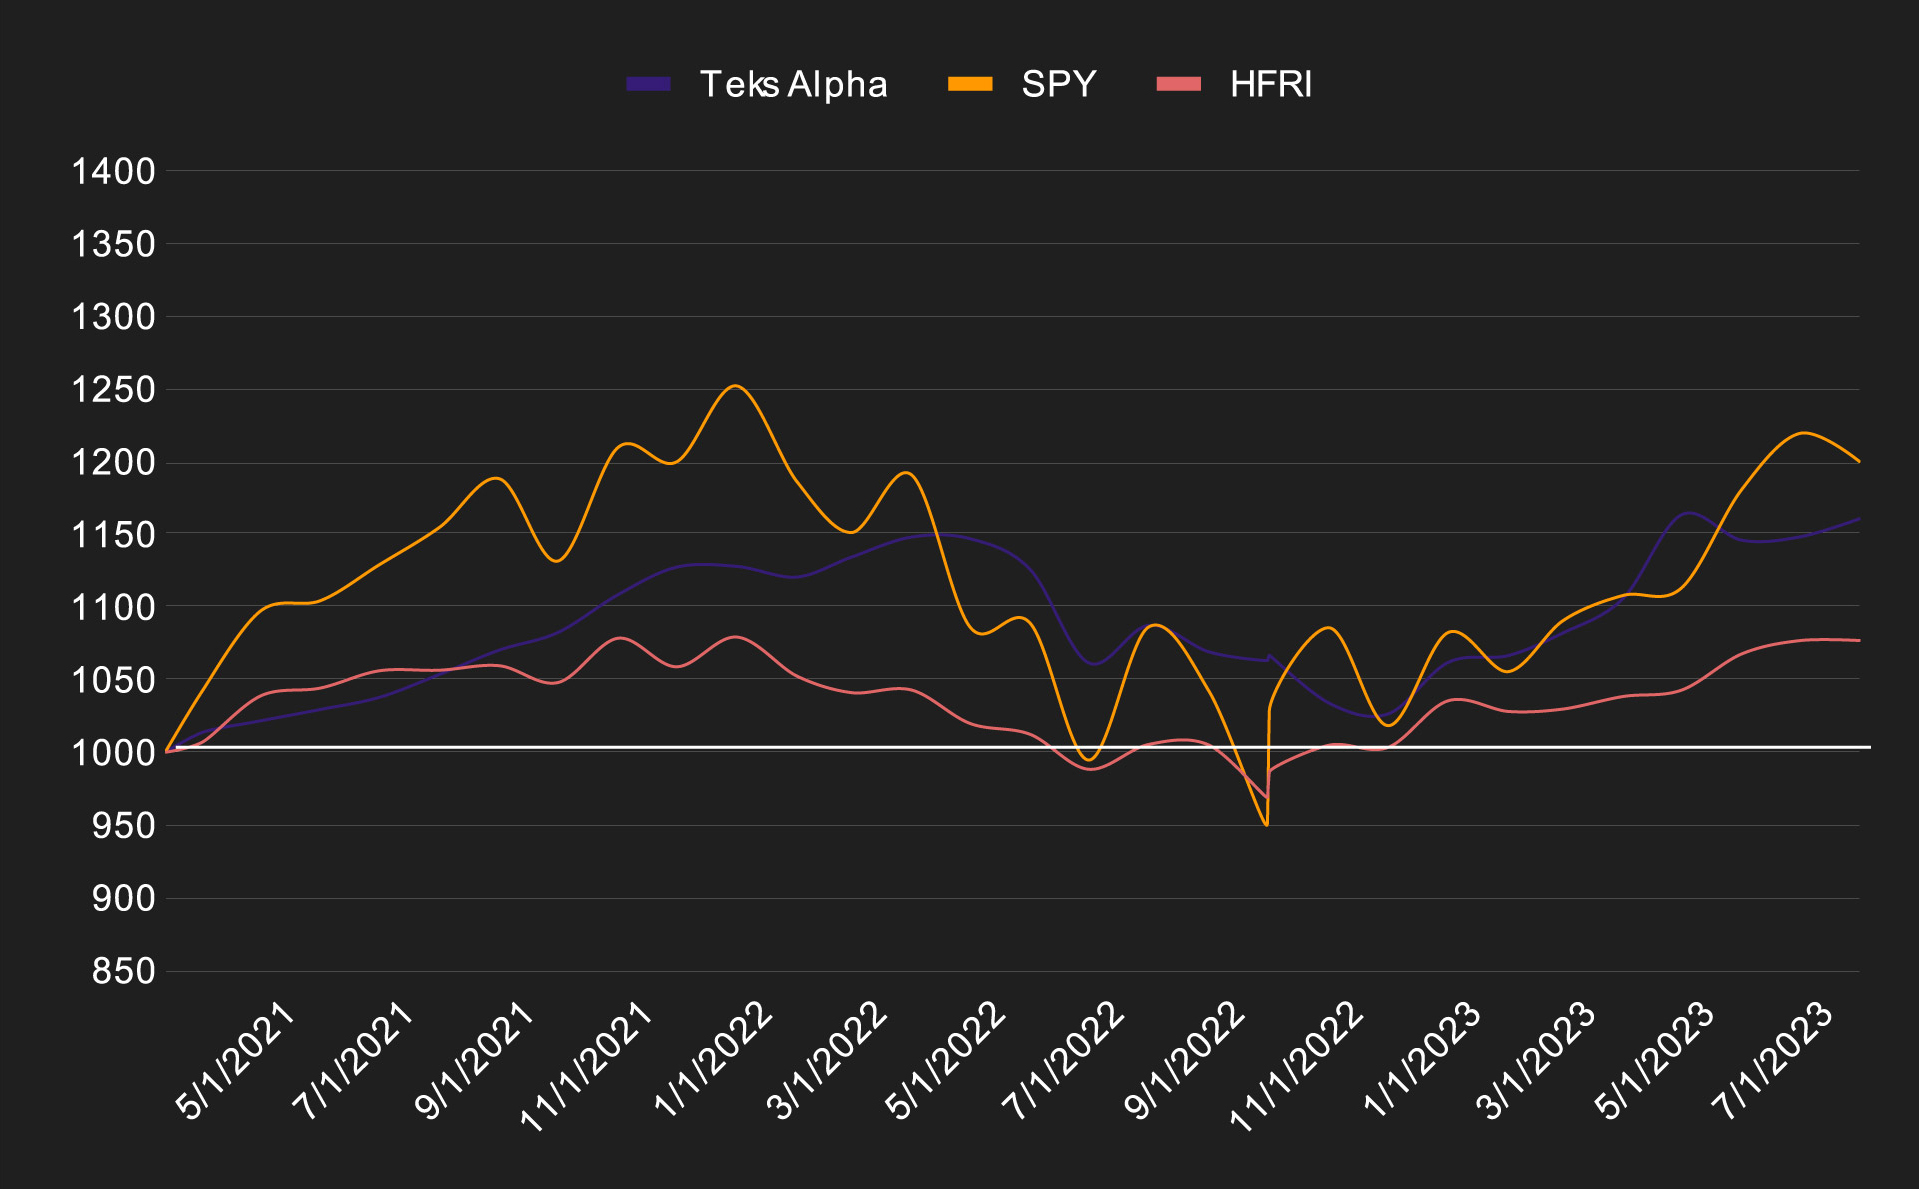
Teks Alpha Performance vs Benchmarks since inception (March 2021)
| TEKS ALPHA | SPY | HFRI | |
|---|---|---|---|
| Effective | 16.08% | 19.96% | 7.68% |
| Annualized | 6.73% | 8.35% | 3.22% |
| STD Dev | 7.01% | 17.75% | 5.95% |
| Shape Ratio | 0.57 | 0.32 | 0.08 |