Market Overview
Cryptocurrencies and traditional markets had a difficult start of the year. Macroeconomic factors including rate hikes, world inflation, QE vs QT and Ukraine/Russia conflict had boosted FUD among investors and traders.
The Nasdaq declined almost -17% from its ATH while BTC went down -52% from its ATH showing high levels of correlation with the tech stock index. Almost $1.5Tn dollars were erased from the crypto market.
Although traders were cutting off risks, some indicators raised our attention and led us to increment deltas during this drawdown. BTC long term IV flattened (and actually went down!) below 80%. In previous drops we saw IV spikes of 150%. The funding rate from perp swaps barely penalized short traders and on chain analysis showed that the Long Term Holders were accumulating positions rather than dumping their assets. All of these indicators (and others) led us thinking that it was likely to see a reversion (which happened during the first week of Feb).
We suffered some pain given that the IV was not high enough to compensate for the market’s DD through vega selling, but we were able to fully recover through the gamma accumulation during January.
Performance
Although our premium collection wasn't enough to compensate for our long delta exposure, we minimized the dd to -0.6% while BTC monthly performance was -17%. Our long deltas finally kicked-in during the first days of Feb but we are cautious given that volatility won't disappear any time soon: FED minutes on Feb 16 and Ukraine's conflict re escalating after Chinese winter games are over.
Teks Alpha Performance (%)
| JAN | FEB | MAR | APR | MAY | JUN | JUL | AUG | SEP | OCT | NOV | DEC | YTD | |
|---|---|---|---|---|---|---|---|---|---|---|---|---|---|
| 2021 | — | — | 1.36 | 0.79 | 0.77 | 0.80 | 1.51 | 1.61 | 1.15 | 2.56 | 1.70 | — | 12.9 |
| 2022 | -0.65 | — | — | — | — | — | — | — | — | — | — | — | -0.65 |
Teks Alpha Performance vs Index
| TEKS A | BTC | BTC IND | HFRX | |
|---|---|---|---|---|
| Effective | 12.05% | -37.25% | -16.14% | -0.13% |
| Annualized | 13.54% | -41.84% | -18.13% | -0.14% |
| STD Dev | 2.90% | 36.38% | 72.75% | 3.61% |
| Shape Ratio | 4.15 | -1.19 | -0.27 | -0.46 |
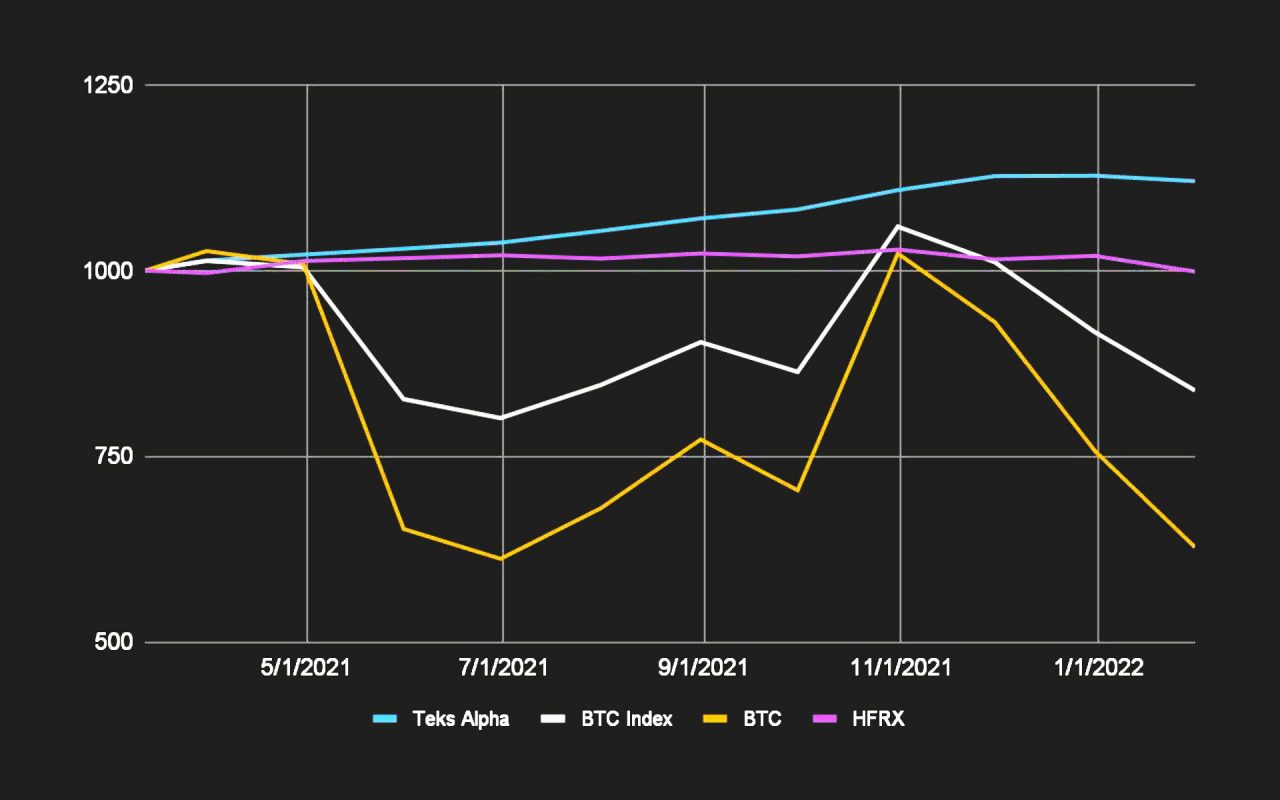 Benchmarks: BTC Index is an index composed 50% by BTC and 50% by cash. BTC price index is conformed by the Bitstamp price of BTC at 18 CEST. The HFRX Global Hedge Fund Index is designed to be representative of the overall composition of the hedge fund universe. It is comprised of all eligible hedge fund strategies; including but not limited to convertible arbitrage, distressed securities, equity hedge, equity market neutral, event driven, macro, merger arbitrage, and relative value arbitrage. The strategies are asset weighted based on the distribution of assets in the hedge fund industry.