Market Overview
August was another eventful month for the financial markets.
Throughout August the SPY posted a -1.7% and the YTD is +17.8%. On the other hand, the Nasdaq Composite performed -2.2% (YTD of 33.9%).
The ever-evolving dynamics of inflation and interest rates continued to be pivotal in shaping market movements. With the Federal Reserve's policy reviews on the horizon, we anticipate a substantial impact on macroeconomic indicators. Their upcoming meeting on September 19th and 20th promises to be a significant event for market participants.
We are still inclined to believe that several indicators point to a deceleration and some items are concerning.
September's historical data suggests a tendency for volatility, with notable events such as the September 2001 tragedy and the Lehman Brothers downfall in 2007. Recent history (past three years) has also shown a bearish pattern for equities during this month.
Notably, during August NVDA reported strong earnings underlining its growth potential in the technology sector. Chairman Powell gave his speech at Jackson Hole, Wyo, and did not surprise the market. He in summary expressed that the Fed will continue to be data dependent as it waits for inflation to go to 2%.
Performance
During August the Fund’s preliminary net return was +1.1%, bringing our YTD net performance to +13.1%.
We are very comfortable with the performance of our model, which has once again demonstrated its resilience to substantial market fluctuations while maintaining a robust risk management.
We are confident that investments and resources added will further improve our already solid track record and will deliver outstanding returns.
Teks Alpha Performance (%)
| JAN | FEB | MAR | APR | MAY | JUN | JUL | AUG | SEP | OCT | NOV | DEC | YTD | |
|---|---|---|---|---|---|---|---|---|---|---|---|---|---|
| 2021 | — | — | 1.36 | 0.79 | 0.77 | 0.80 | 1.51 | 1.61 | 1.15 | 2.56 | 1.70 | — | 12.9 |
| 2022 | -0.65 | 1.22 | 1.22 | -0.10 | -1.85 | -5.7 | 2.35 | -1.61 | -0.5 | 0.33 | —3.1 | —0.7 | -9.0 |
| 2023 | 3.5 | 0.45 | 1.45 | 2.20 | 5.20 | -1.50 | 0.2 | 1.10 | — | — | — | — | 13.1 |
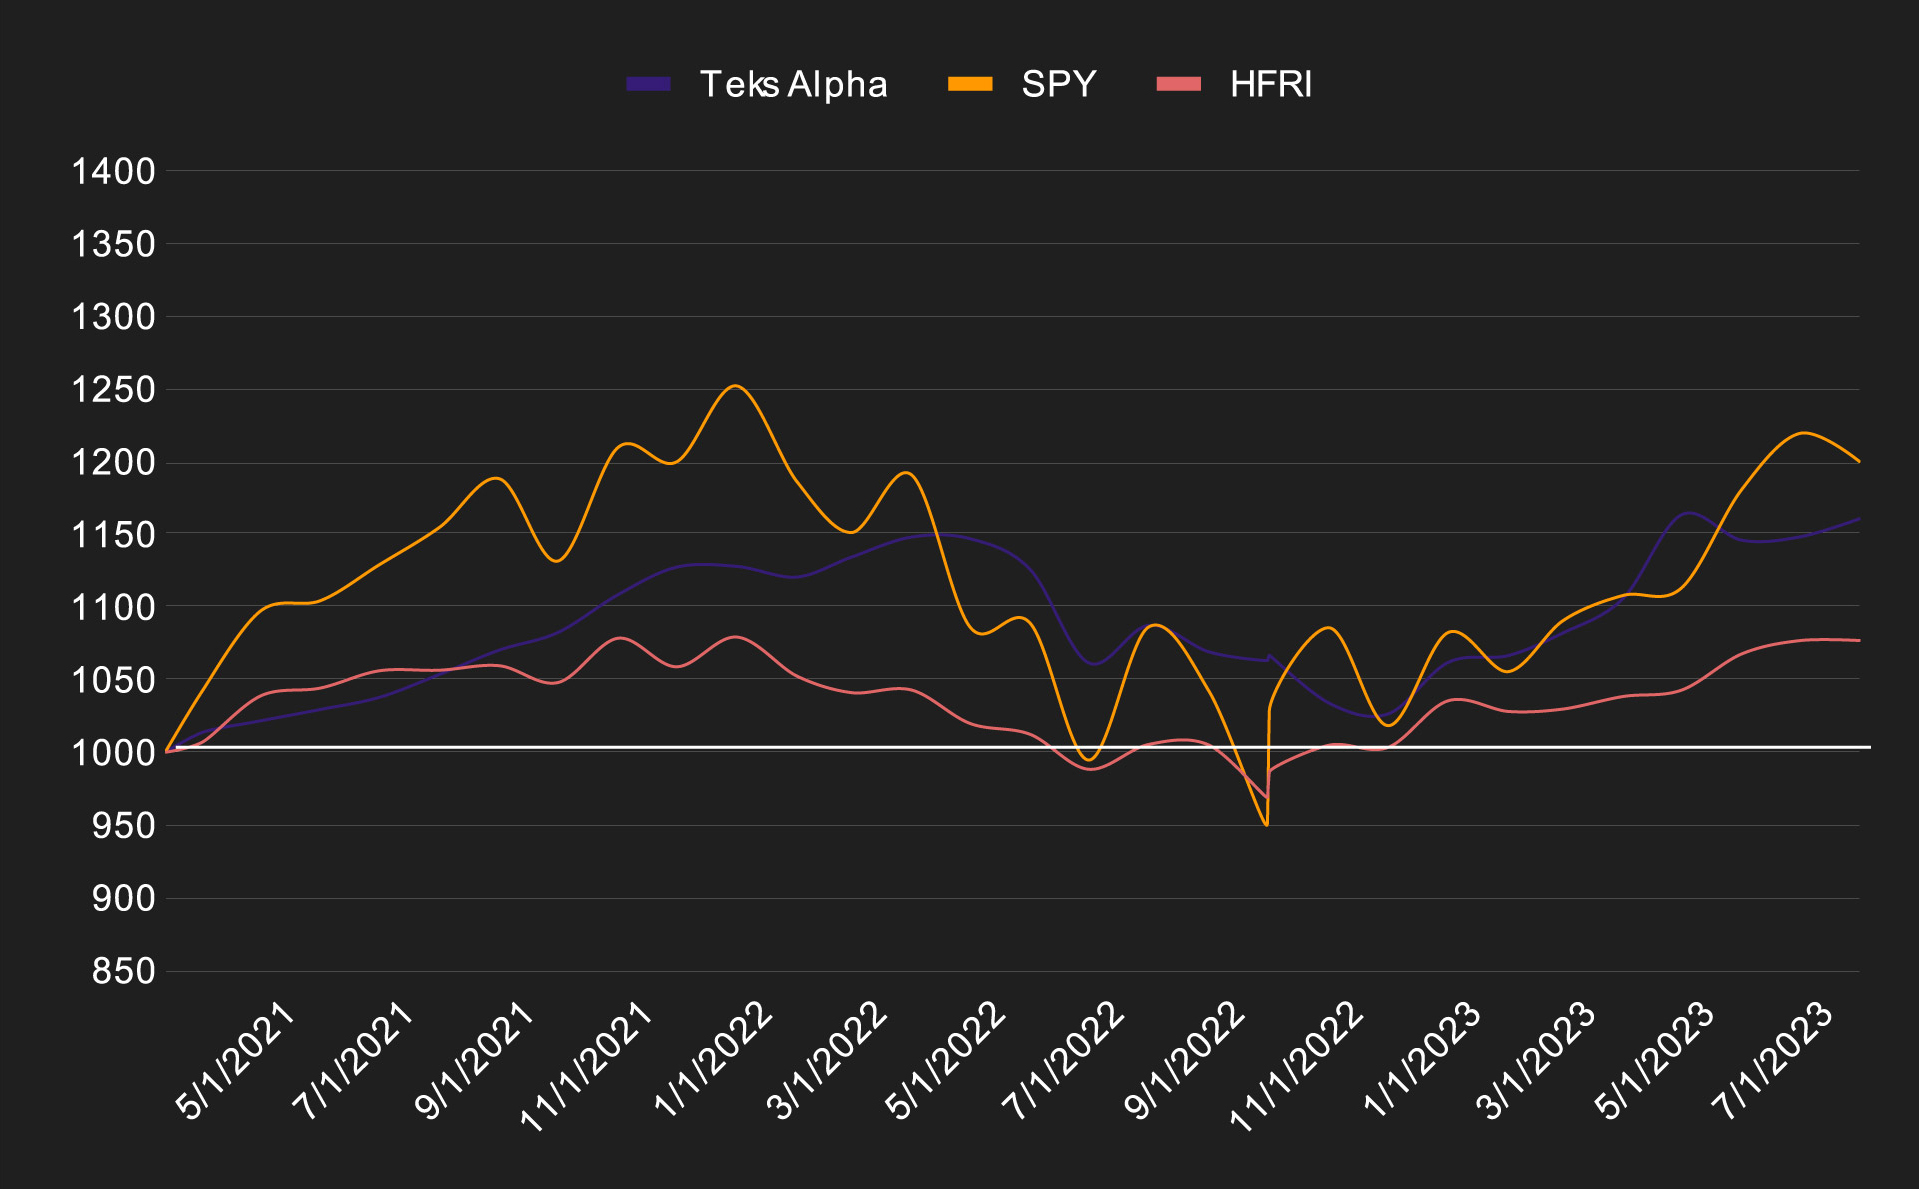
Teks Alpha Performance vs Benchmarks since inception (March 2021)
| TEKS ALPHA | SPY | HFRI | |
|---|---|---|---|
| Effective | 16.08% | 19.96% | 7.68% |
| Annualized | 6.73% | 8.35% | 3.22% |
| STD Dev | 7.01% | 17.75% | 5.95% |
| Shape Ratio | 0.57 | 0.32 | 0.08 |