Market Overview
April proved to be another eventful month for the financial markets, with the Federal Reserve's policy decision wavering between rate hikes and cuts, and the second largest bank failure in US history adding to the turbulence. Historically, April has been a strong month for US equities, but this year's events have created an uncertain landscape.
Expectations about the Federal Reserve's policy decision shifted throughout April. While the Fed is scheduled to meet again in early May, with the potential outcome of a 25 basis point increase very likely, economists remain uncertain about whether further rate hikes are on the horizon.
April saw the failure of the First Republic National Bank, the second-largest bank failure in US history. This California-based bank, which catered to wealthy clients, surpassed the previous second-largest failure, Silicon Valley Bank. Washington Mutual's collapse in 2008 still stands as the largest bank failure to date.
Throughout April, the SPY posted a +1.6% gain (YTD +9.2%), while the Nasdaq Composite performed +0.5% (YTD +21.4%). The key themes of inflation and interest rates continue to dominate, as well as questions surrounding whether the US market will experience a soft landing or a recession.
As we move into May, the financial landscape remains uncertain. Investors and market participants will be closely monitoring the Federal Reserve's policy decisions, inflation concerns, and the ongoing impact of recent bank failures. With multiple factors in play, the markets are likely to continue experiencing volatility in the coming weeks.
Performance
During April, the Fund’s net return was +2.2%. This brings the YTD net performance to +7.8%.
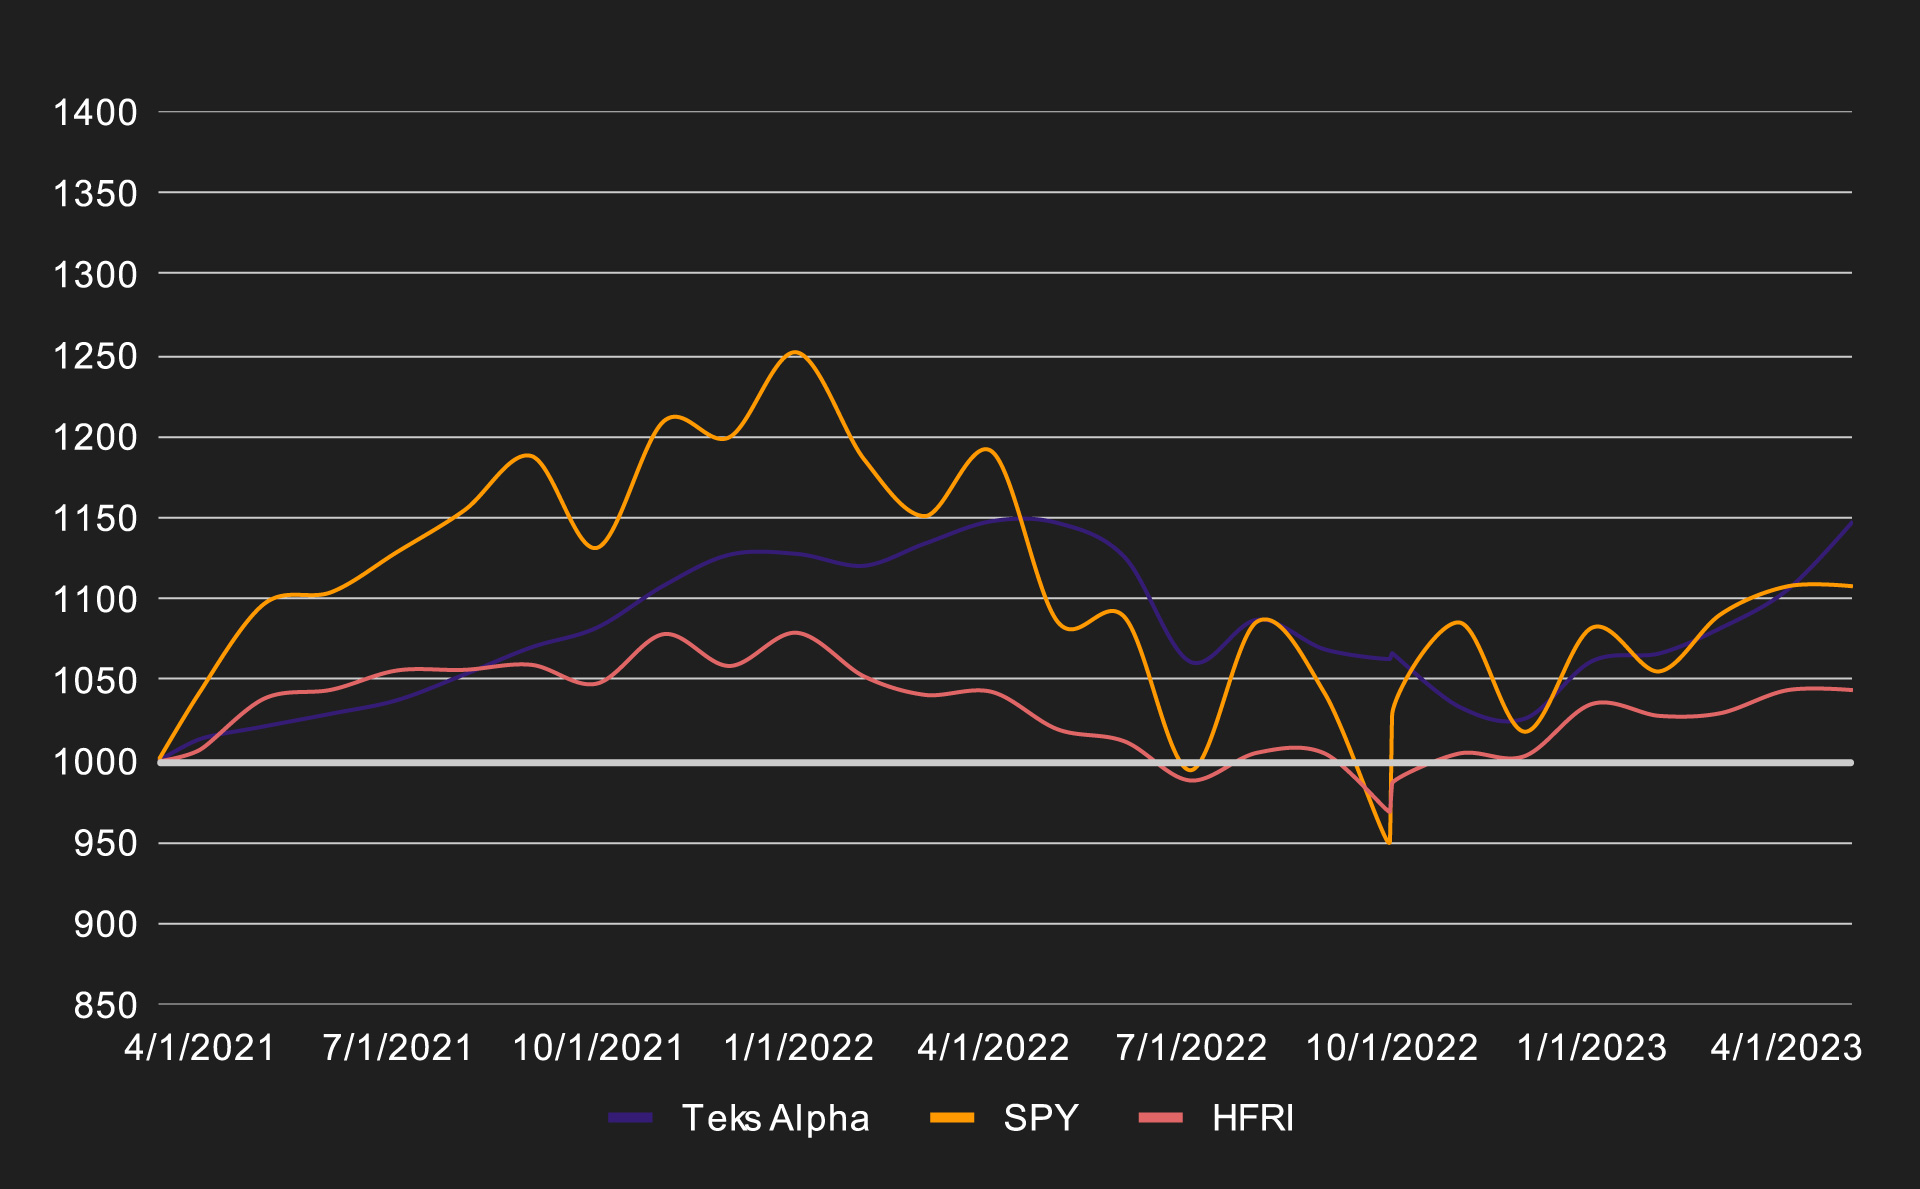
Remarkably, this performance was achieved with significantly lower volatility than the underlying asset class (S&P 500). For example consider the difference in drawdowns: while the S&P 500 experienced a maximum price decline of -9% during the first two weeks of March, the Fund’s drawdown remained below -2%.
The results of deploying our model on the SPY are indeed very impressive. In our personal account (where we test all trades before executing them in the Fund), we had a +65% total return since December 2022, compared to a +1% return of the SPY during the same time period.
We again expect volatile months ahead, as the uncertainty about the future of the global economy might start to get more clarity.
Teks Alpha Performance (%)
| JAN | FEB | MAR | APR | MAY | JUN | JUL | AUG | SEP | OCT | NOV | DEC | YTD | |
|---|---|---|---|---|---|---|---|---|---|---|---|---|---|
| 2021 | — | — | 1.36 | 0.79 | 0.77 | 0.80 | 1.51 | 1.61 | 1.15 | 2.56 | 1.70 | — | 12.9 |
| 2022 | -0.65 | 1.22 | 1.22 | -0.10 | -1.85 | -5.7 | 2.35 | -1.61 | -0.5 | 0.33 | —3.1 | —0.7 | -9.0 |
| 2023 | 3.5 | 0.45 | 1.45 | 2.20 | — | — | — | — | — | — | — | — | 7.74 |
Teks Alpha Performance vs Benchmarks since inception (March 2021)
| TEKS ALPHA | SPY | HFRI | |
|---|---|---|---|
| Effective | 10.58% | 10.79% | 3.05% |
| Annualized | 5.15% | 5.25% | 1.49% |
| STD Dev | 6.64% | 18.58% | 6.19% |
| Shape Ratio | 0.36 | 0.13 | -0.20 |