Market Overview
Once again, an end of month rally took place on risky assets (specially crypto tokens) after several weeks of sideways trading (with downside pressure) and choppy price action. Many factors, from a glimmer of hope in Ukraine-Russia talks, pure technical indicators, and a better macroeconomic outlook triggered such rally.
Bitcoin was down almost -15% by mid-month and ended up with a monthly return of +3.5%, while the DefiPerp (DeFi Index) went from a -20% to a +27%. Traditional markets saw a similar price swing, dropping -6.7% by mid March and ending +3.70% (S&P 500). New waves of optimism are reflected and can't be ignored but sentiment can be quickly reversed on any disappointment from the geopolitical front to the economy. Equity markets are not pricing (yet) whether the yield curve inversion is or is not anticipating a recession as it almost always does, which could get aggravated if war negotiations fail and commodities add extra inflation pressures. Crypto prices will also suffer under this scenario and BTC price will likely follow the trend of equity assets rather than gold or “safer assets” (btc\gold correlation was <0 during the entire Ukraine conflict).
The good news is that a strong level of resistance at $45k was broken. The challenge now is to see whether such previous price resistance becomes a price support. If so, we are almost sure that prices will ramp up to new highs once more.
Performance
During March the Fund preliminary returned +1.05%. We kept more than 50% of cash in our portfolio waiting for further definitions especially regarding war news. The structured products were solid while the market was heading down to the 30ks and we were able to capture premiums from our collateralized option selling during the end of month rally. Looking forward we are expanding our structured products to altcoins and implementing a pure quant strategy to enhance profits with an efficient risk control.
Teks Alpha Performance (%)
| JAN | FEB | MAR | APR | MAY | JUN | JUL | AUG | SEP | OCT | NOV | DEC | YTD | |
|---|---|---|---|---|---|---|---|---|---|---|---|---|---|
| 2021 | — | — | 1.36 | 0.79 | 0.77 | 0.80 | 1.51 | 1.61 | 1.15 | 2.56 | 1.70 | — | 12.9 |
| 2022 | -0.65 | 1.20 | 1.05 | — | — | — | — | — | — | — | — | — | 1.62 |
Teks Alpha Performance vs Index
| TEKS A | BTC | BTC IND | HFRX | |
|---|---|---|---|---|
| Effective | 14.61% | -26.78% | -9.28% | 0.61% |
| Annualized | 13.89% | -25.46% | -8.82% | 0.58% |
| STD Dev | 2.65% | 67.86% | 33.93% | 3.01% |
| Shape Ratio | 4.67 | -0.40 | -0.30 | -0.31 |
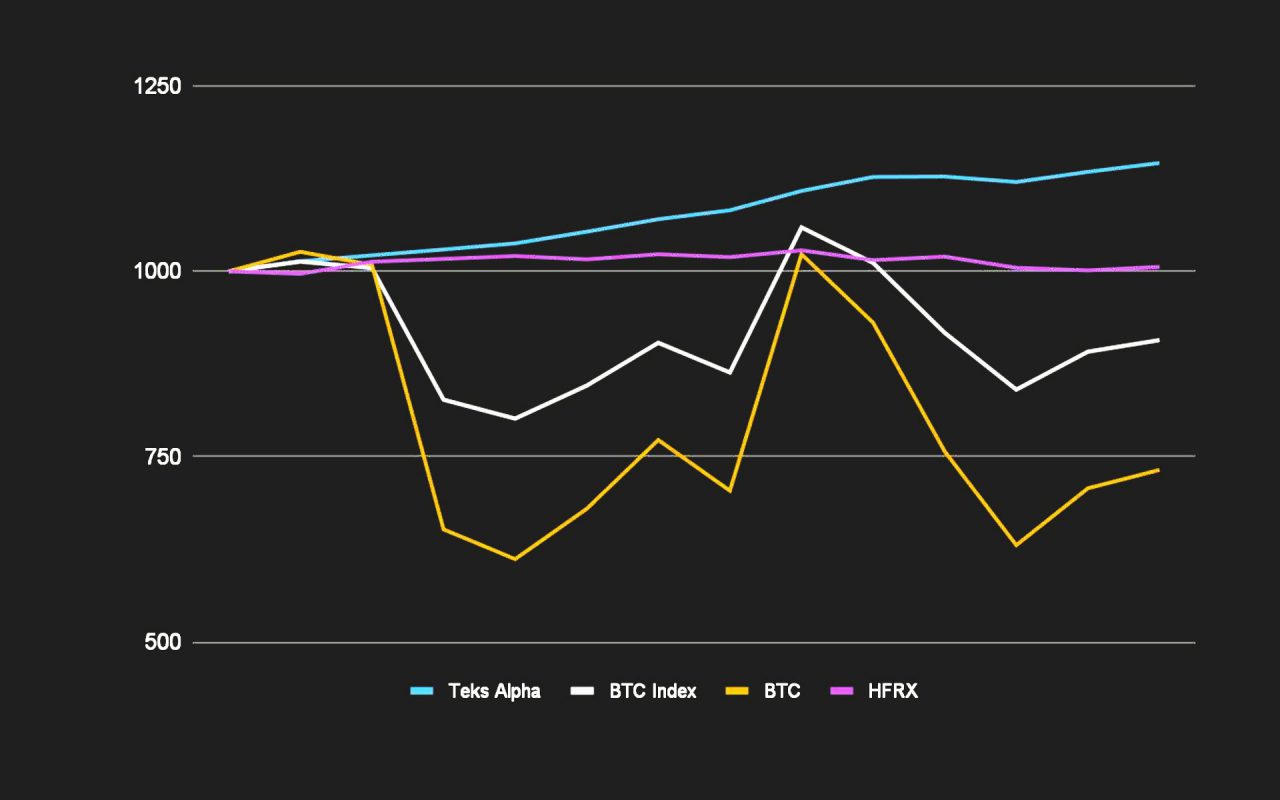 Benchmarks: BTC Index is an index composed 50% by BTC and 50% by cash. BTC price index is conformed by the Bitstamp price of BTC at 18 CEST. The HFRX Global Hedge Fund Index is designed to be representative of the overall composition of the hedge fund universe. It is comprised of all eligible hedge fund strategies; including but not limited to convertible arbitrage, distressed securities, equity hedge, equity market neutral, event driven, macro, merger arbitrage, and relative value arbitrage. The strategies are asset weighted based on the distribution of assets in the hedge fund industry.