Market Overview
July was a positive month for both traditional and crypto assets as both significantly rebounded from June. BTC rose 17%, ETH was up +56%, while the DeFi space had a price increase (as per the DeFi Perp) of 38%. Both ETH and major Defi tokens in general had an impressive rebound.
In the case of traditional assets, amid certain economic uncertainty, the S&P ended up a strong +9.2% for the month (the best month since November 2020) and the Nasdaq was up +11.8%. US Bonds (safe haven) were profitable as they rose +4.1% and Gold went down, again, -1.4%.
Even when the US economy might be technically entering a recession (GDP -0.9% in the second quarter after a -1.6% drop in the first quarter) and rake hikes totalling 225 bps, the markets had a very positive month. Several factors contributed to this rebound. One was the strong earnings season. 3 out of 4 companies beat their earnings estimates. Also, the FED expressed that it might reduce the pace of tightening. However, both Voyager and Celsius filed for bankruptcy in early July but no additional casualties appeared. Coinbase traded down towards the end of the month when Bloomberg disclosed that the SEC was analyzing whether the firm had allowed its users to trade unregistered securities on its platform.
However, it is not clear whether this is a bear market rally or a new bull market rally. Several challenges lie ahead for both traditional and digital assets. Since the beginning of 2022 given the rally from the market bottom, it's the first time we see the weekly skew between calls and puts in negative territory, both in BTC and ETH.
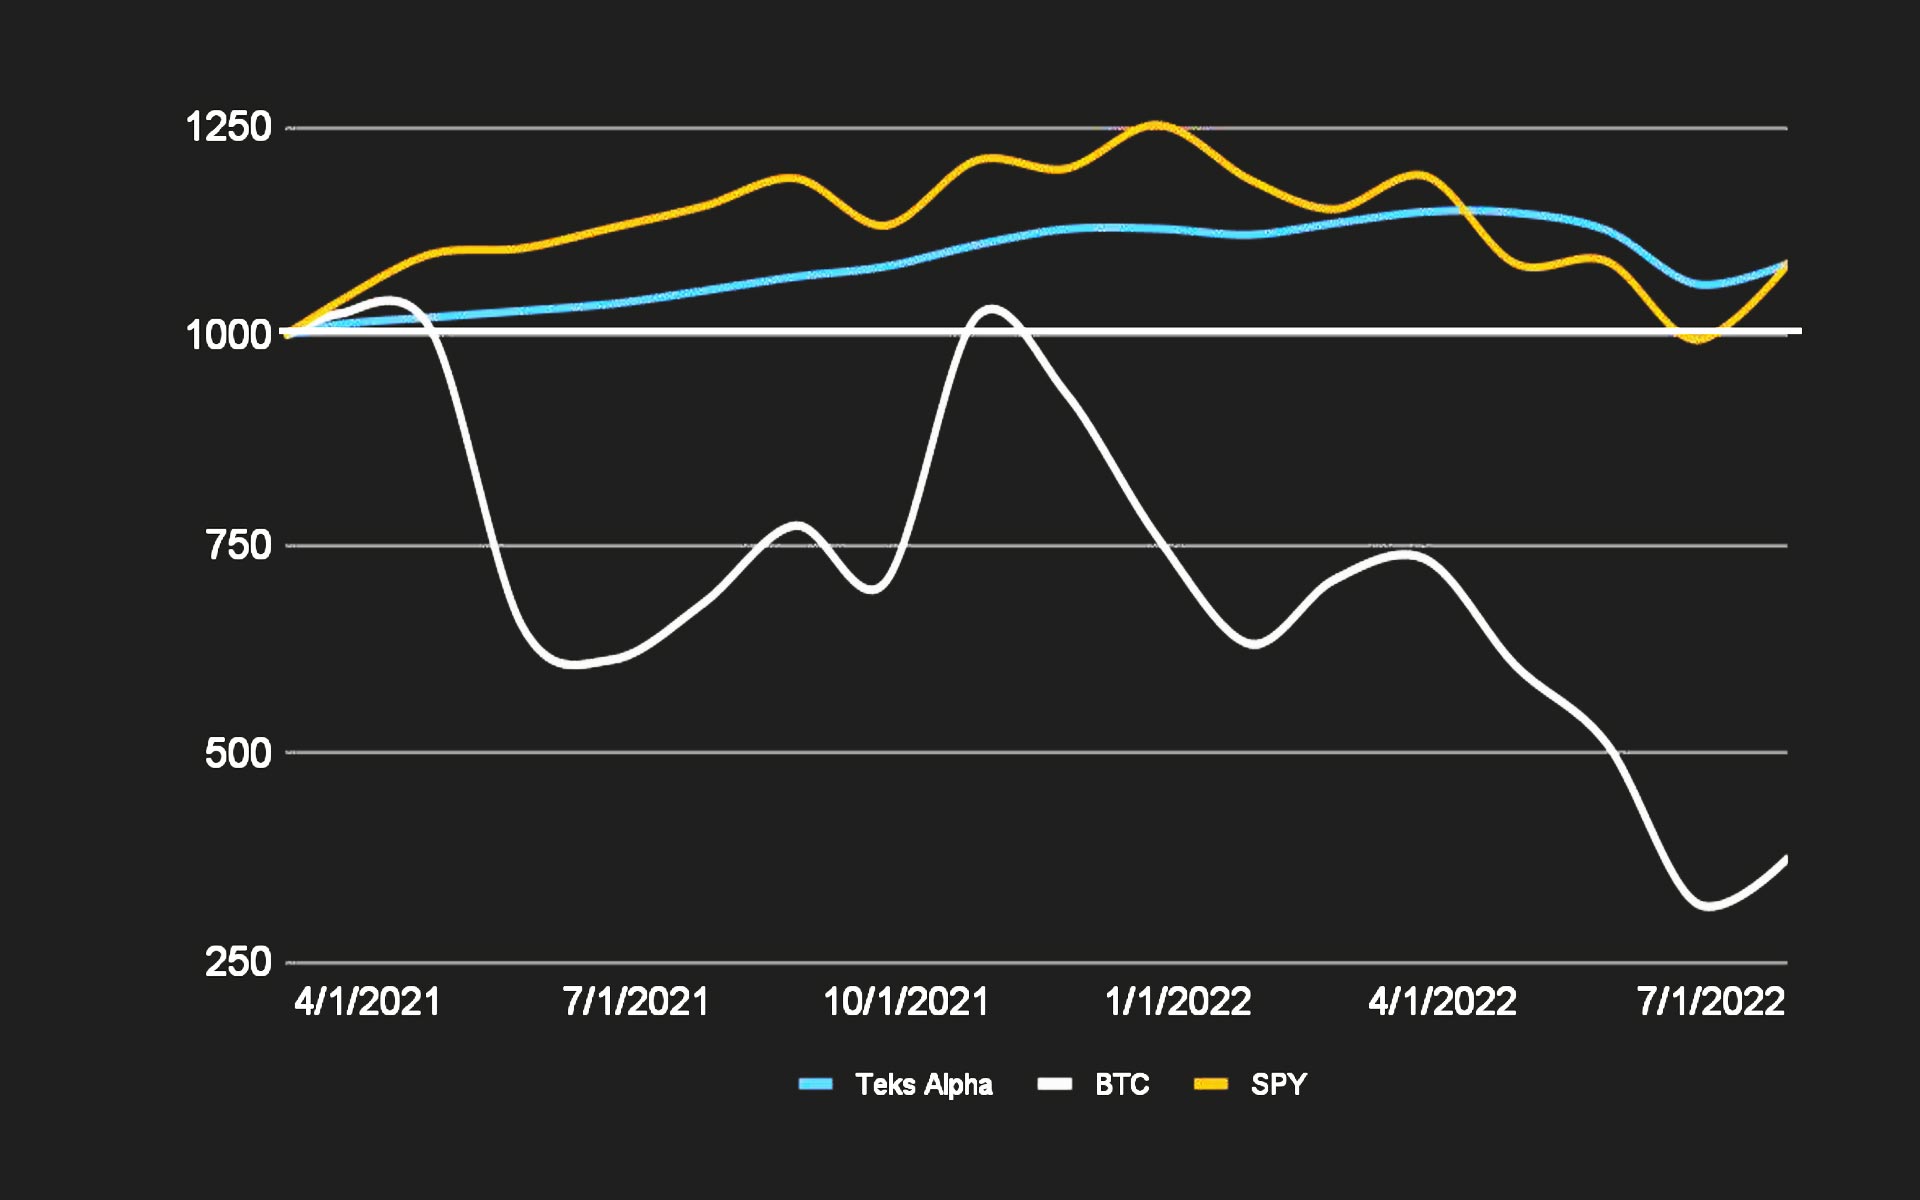
Since Teks Alpha’s inception in mid March 2021, BTC is down -62.4% with a max drawdown (“max dd”) of -72%, ETH performed +2.7% with a max dd of -80%.Regarding traditional markets, Nasdaq is down -0.5% with a max dd of -33%, the S&P is up +8.6% with a max dd of -23%, and US Bonds are down -8.3% with a max dd of -24%. Gold on the other hand is up 3.6% but also has had a deep drawdown of -20%.
In comparison, Teks Alpha has achieved a total return since inception of +8.6% net of fees, with a max volatility of 6.6% and max drawdown of -7.5% overcoming one of the most difficult market conditions.
Volatility with large up/down price movements will continue as long as the macro remains fragile.
Performance
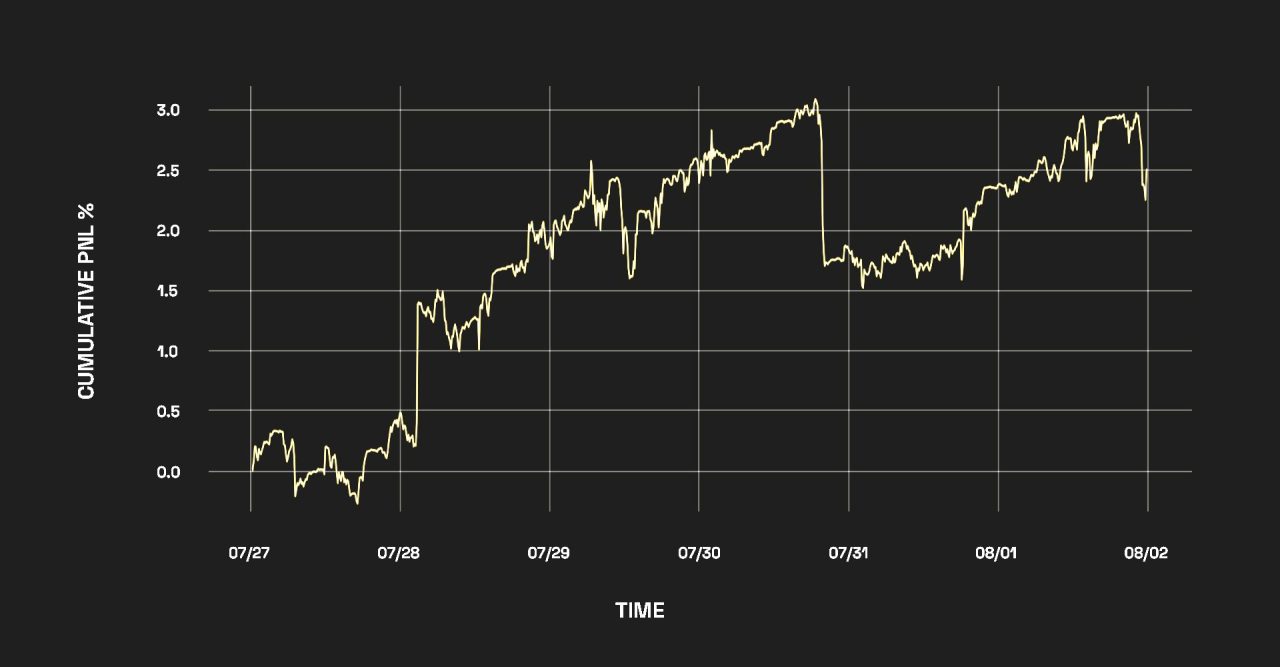
During the month of July, the Fund returned +2.35%. Although we have an overall long delta exposure, we have been hedging downside risks.
We continue to refine our models; as expressed in our prior newsletters, we have launched Teks Trend, a pure high frequency quant sub-strategy which we believe will produce very positive returns.
Looking forward, we are expecting volatile months as both traditional and digital markets are still facing huge challenges ahead. Nevertheless, we are still seeking to further increase our net monthly returns.
Teks Alpha Performance (%)
| JAN | FEB | MAR | APR | MAY | JUN | JUL | AUG | SEP | OCT | NOV | DEC | YTD | |
|---|---|---|---|---|---|---|---|---|---|---|---|---|---|
| 2021 | — | — | 1.36 | 0.79 | 0.77 | 0.80 | 1.51 | 1.61 | 1.15 | 2.56 | 1.70 | — | 12.9 |
| 2022 | -0.65 | 1.20 | 1.05 | -0.10 | -1.85 | -5.7 | 2.35 | — | — | — | — | — | -3.7 |
Teks Alpha Performance vs Benchmarks since inception (March 2021)
| TEKS A | BTC | SPY | |
|---|---|---|---|
| Effective | 8.65% | -62.49% | 8.62% |
| Annualized | 6.24% | -45.07% | 6.22% |
| STD Dev | 6.65% | 70.43% | 18.02% |
| Shape Ratio | 0.56 | -0.68 | 0.21 |