Market Overview
2023 indeed started with a bang. Global markets posted an extremely solid month across the board.
In the case of equities, the SPY started the year with a +6.3% gain. On the other hand, the Nasdaq performed +10.7%. This was mostly due to earning reports coming slightly better than expected or investors directly ignoring weaker reports. As an example, MSFT reported the slowest sales growth in 6 years but the stock price went up +3.3% in the week. The same applied to American Express and Alaska Airlines, as an example.
This January rally was a sign of relief after the dismal 2022 equities performance. Indeed, 2022 was the worst equities performance in 14 years (since 2008). It remains to be seen however if this momentum will continue in February, which historically has been one of the worst months for equities. On the bullish side, when January has posted positive results the equities market has been in the green side 86% of the time for the past 72 years.
The key themes still remain inflation and interest rates. And whether the US market will experience a soft landing instead of a recession.
US Bonds (safe haven) performed extremely well too, around +7% and Gold prices ended the month +4.8%.
Bitcoin and the broader crypto market traded up aggressively over the month of January with increased trading volumes recorded. During January, BTC ended up performing +39.9% and ETH around +30%. Short liquidations played an important role in this rally. At the beginning of January the BTC options OI was 75% lower than a year ago. Furthermore, the IV was 50% lower on average, meaning that investors were not compensated with premiums for the lack of liquidity and volume, which made spreads wider and hence almost impossible to trade large volumes. This was another disadvantage for those trying to set up efficient digital asset structures.
If traditional markets continue to rally we might see an extension of this bullish momentum in BTC with prices heading up to the 28k level where the Fibonaccis will generate some level of resistance. In ETH, we see a possible extension to 1.85K.
Performance
During January, the Fund returned +3.5%.
As expressed in our previous newsletters, we are in the process of shifting our investments to traditional markets. For a variety of reasons we are starting to increase our exposure to traditional markets using our proprietary models developed over the past 2 years and deployed in the digital asset space during such timeframe. This is based on the much higher liquidity and granularity such markets offer.
The results of deploying our model in traditional markets (i.e. SPY) are indeed very impressive. We had a +24.5% total return in December and January combined, compared to a flat return of the SPY during the same time period.
The first week of February will be key to assess whether the momentum keeps going or not. Indeed, the Fed's meeting on February 1 as well as the employment figures are released on Friday. Also, more than 33% of the SPY companies are releasing their earning reports, including tech giants Amazon, Apple, Meta and Alphabet.
In the case of the Fed, a 25 bps increase is expected, slowing down the rate hikes.
Going forward, we plan to keep just 10 to 15% invested in digital assets via structured products, with a long bias in both BTC and ETH. We are still targeting a +3 to 4% net monthly return.
Teks Alpha Performance (%)
| JAN | FEB | MAR | APR | MAY | JUN | JUL | AUG | SEP | OCT | NOV | DEC | YTD | |
|---|---|---|---|---|---|---|---|---|---|---|---|---|---|
| 2021 | — | — | 1.36 | 0.79 | 0.77 | 0.80 | 1.51 | 1.61 | 1.15 | 2.56 | 1.70 | — | 12.9 |
| 2022 | -0.65 | 1.22 | 1.22 | -0.10 | -1.85 | -5.7 | 2.35 | -1.61 | -0.5 | 0.33 | —3.1 | —0.7 | -9.0 |
| 2023 | 3.5 | — | — | — | — | — | — | — | — | — | — | — | 3.5 |
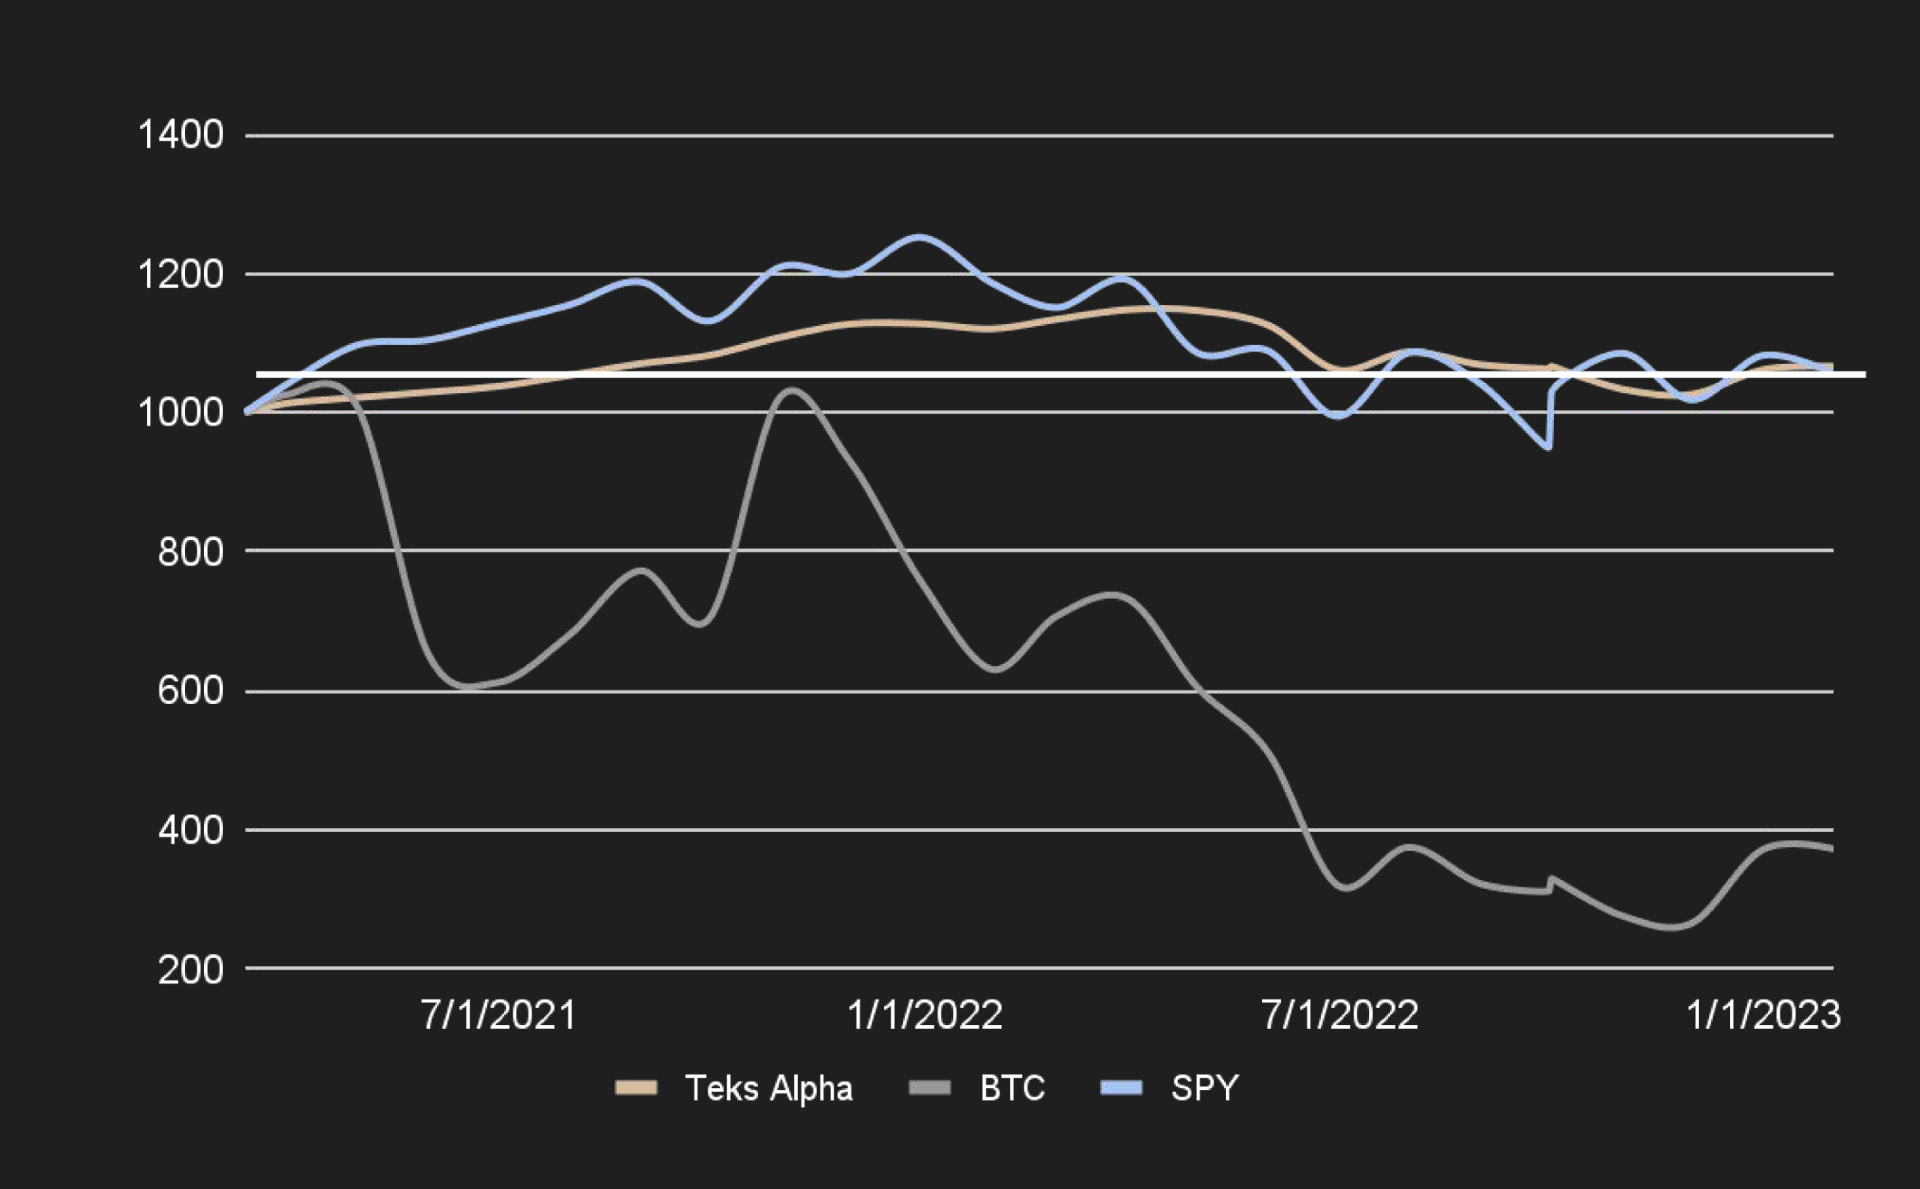
Teks Alpha Performance vs Benchmarks since inception (March 2021)
| TEKS A | BTC | SPY | |
|---|---|---|---|
| Effective | 6.07% | -62.80% | 8.24% |
| Annualized | 3.36% | -34.73% | 4.56% |
| STD Dev | 6.90% | 69.36% | 19.56% |
| Shape Ratio | -0.17 | -0.57 | 0.00 |
