Market Overview
2023 indeed started with a bang in January, but such a positive momentum reversed in mid to late February. As expressed in our prior newsletter, February historically has been one of the worst months for equities.
And this was no exception. In the case of equities, during the month the SPY posted a -2.4% loss (YTD +3.7%) and the Nasdaq Composite performed -1% (YTD +9.5%).
The key themes still remain inflation and interest rates. And whether the US market will experience a soft landing instead of a recession.
With 96% of the S&P companies reporting Q4 earnings, the results have not been good. Just over 68% of companies reported positive EPS surprises (below the 5 year average of 77%). The average EPS beat has been around 1%, also well below the 5 year average of 8.6%.
February was also a negative month for both US Bonds (safe haven) and Gold, performing -3.2% and -5.6%, respectively.
Bitcoin and the broader crypto market traded up initially, but then went down with the overall traditional markets. During February, BTC and ETH ended up performing almost flat.
Performance
During February, the Fund returned +0.45%.
As expressed in our previous newsletters, for a variety of reasons, we have deployed almost all of our assets in traditional markets using our proprietary models developed and deployed in the digital asset space for more than 2 years.
The results of deploying our model in traditional markets (i.e. SPY) are indeed very impressive. In our personal account (where we test all trades before executing them in the Fund), we had a +32% total return since December 2022, compared to a -2.6% return of the SPY during the same time period.
We expect our positive returns in the Fund to kick in in the next 30 to 60 days as our option structures accelerate the upside pace due to the time decay.
During February we saw a reversal of the post FOMC January exuberance. US CPI and PPI data came stronger than expected and also the ISM added to inflation concerns. US Treasury yields increased accordingly as a response and global equities went also lower in the past couple of weeks. Initially, digital assets were a little bit more resilient but eventually went down too.
A reversal from here would require good news in the macro data and Investors will closely monitor the next US CPI data to be released on March 14th. The FOMC meets again on March 21 and 22 and futures are pricing a 72% chance of a 25 bps rate hike and a 28% chance of a 50 bps rate hike.
Going forward, we plan to keep up to 10% invested in digital assets via structured products, with a long bias in both BTC and ETH.
Given our personal account performance and our enhanced proprietary option structure model, we are still targeting a +3 to +4% net monthly return.
Teks Alpha Performance (%)
| JAN | FEB | MAR | APR | MAY | JUN | JUL | AUG | SEP | OCT | NOV | DEC | YTD | |
|---|---|---|---|---|---|---|---|---|---|---|---|---|---|
| 2021 | — | — | 1.36 | 0.79 | 0.77 | 0.80 | 1.51 | 1.61 | 1.15 | 2.56 | 1.70 | — | 12.9 |
| 2022 | -0.65 | 1.22 | 1.22 | -0.10 | -1.85 | -5.7 | 2.35 | -1.61 | -0.5 | 0.33 | —3.1 | —0.7 | -9.0 |
| 2023 | 3.5 | 0.45 | — | — | — | — | — | — | — | — | — | — | 3.9 |
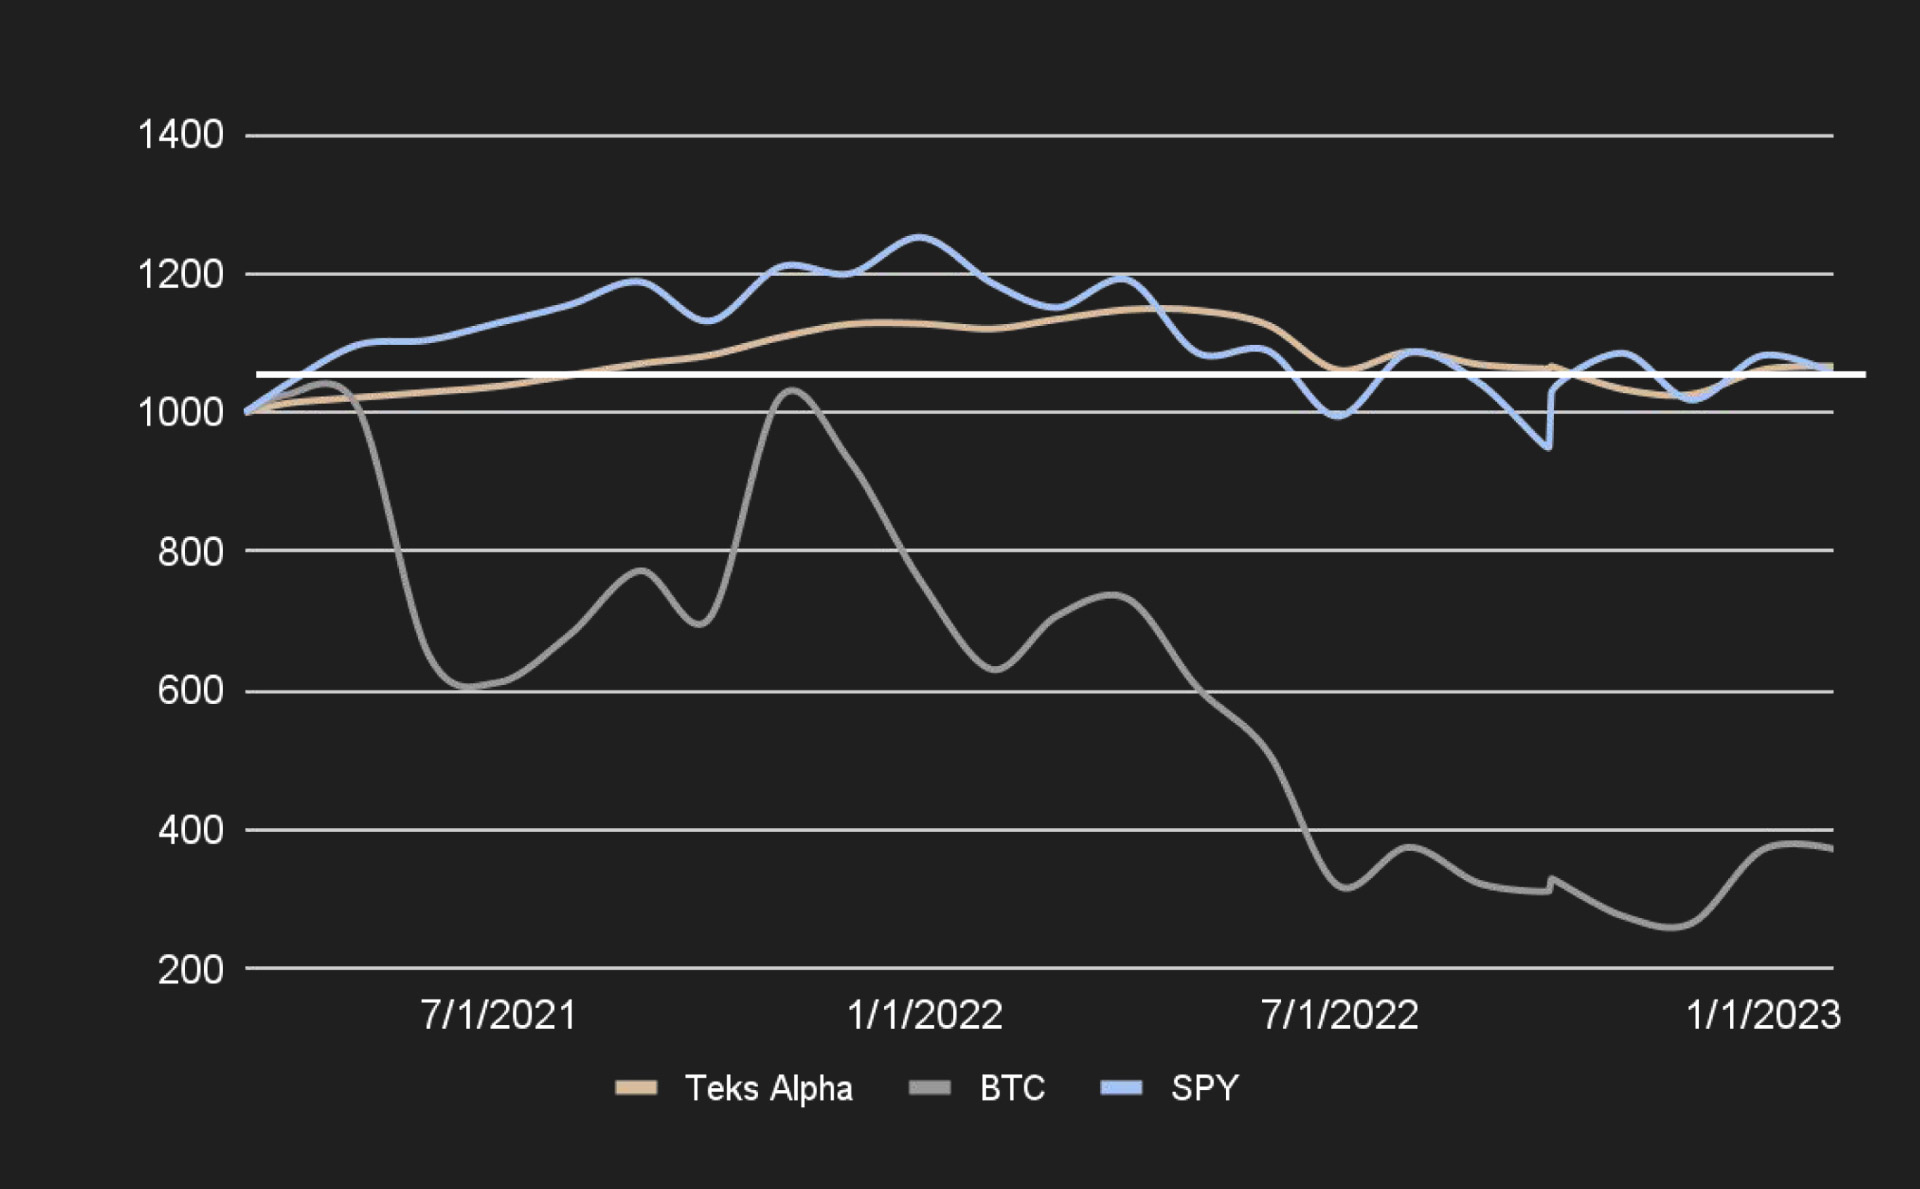
Teks Alpha Performance vs Benchmarks since inception (March 2021)
| TEKS A | BTC | SPY | |
|---|---|---|---|
| Effective | 6.66% | -62.76% | 5.55% |
| Annualized | 3.52% | -33.15% | 2.93% |
| STD Dev | 6.75% | 67.86% | 19.24% |
| Shape Ratio | 0.15 | -0.53 | 0.02 |