Market Overview
Although BTC extended a 2 day 20% rally by the end of the month following a prolonged period of depressing price action, February has been another wild ride for crypto and traditional asset managers. The main trigger of this wave of turbulence has been the war in Ukraine.
As expected, given Russia and Ukraine roles as worldwide heavyweights primary exporters, commodity indexes rallied almost +11% while equity indexes slumped adding an extra -5% loss to a total poor YTD return of -9% on the S&P 500 and -12% on Nasdaq.
This last rebound in crypto prices shifted again the conception of the nature of Bitcoin as a volatile (risky-tech type) wild asset to a gold-like property with special value at a period of geopolitical turmoil, thus, potential workaround for Russia sanctions. Teks Capital don't see any long-medium term benefit on any crypto asset that would serve as a safe haven for individuals or corporations that are not allowed to trade through conventional financial rails and institutions. If crypto starts to be seen as a dishonest shortcut, more controls over crypto will be imposed, less flexibility on regulators for approving new crypto-regulated products will be seen and big institutions will hold their crypto expansion and adoption plans. We uphold the view that the value in crypto markets (overall) lies in the fact that crypto is a new multi-features technology and an asset class, which can enhance a portfolio performance and also add considerable risk if volatility is not professionally managed.
Performance
During the month of February, the Fund returned +1.20%. We captured good premiums when market dropped through our short-vega products, while also recovered our long deltas losses from January. Macro events (FOMC) will add risk during March, so besides we continue to see bullish signals (on-chain analysis specially) we do see potential downside risks if macro news comes worse than expected. Fully quant strategies will be implemented during March.
Teks Alpha Performance (%)
| JAN | FEB | MAR | APR | MAY | JUN | JUL | AUG | SEP | OCT | NOV | DEC | YTD | |
|---|---|---|---|---|---|---|---|---|---|---|---|---|---|
| 2021 | — | — | 1.36 | 0.79 | 0.77 | 0.80 | 1.51 | 1.61 | 1.15 | 2.56 | 1.70 | — | 12.9 |
| 2022 | -0.65 | 1.20 | — | — | — | — | — | — | — | — | — | — | 0.56 |
Teks Alpha Performance vs Index
| TEKS A | BTC | BTC IND | HFRX | |
|---|---|---|---|---|
| Effective | 13.42% | -29.26% | -10.84% | 0.13% |
| Annualized | 13.88% | -30.25% | -11.20% | 0.13% |
| STD Dev | 2.77% | 35.37% | 70.74% | 3.11% |
| Shape Ratio | 4.47 | -0.90 | -0.18 | -0.44 |
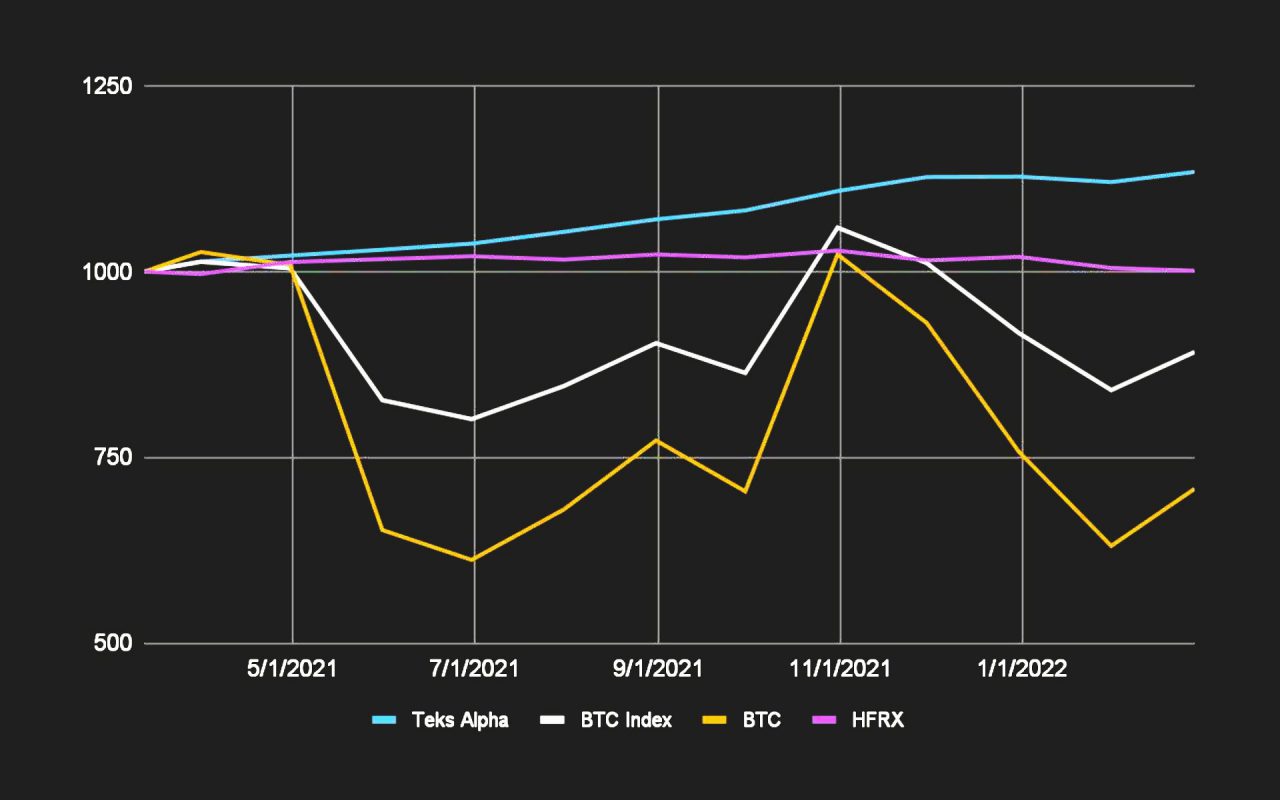 Benchmarks: BTC Index is an index composed 50% by BTC and 50% by cash. BTC price index is conformed by the Bitstamp price of BTC at 18 CEST. The HFRX Global Hedge Fund Index is designed to be representative of the overall composition of the hedge fund universe. It is comprised of all eligible hedge fund strategies; including but not limited to convertible arbitrage, distressed securities, equity hedge, equity market neutral, event driven, macro, merger arbitrage, and relative value arbitrage. The strategies are asset weighted based on the distribution of assets in the hedge fund industry.