Market Overview
August was a negative and a highly volatile month for both traditional and digital assets. BTC yielded -14% and ETH was down -7.3% outperforming BTC with the merge still dominating the crypto news. The BTC price had intra-month variations of +/-10% and fell short of strength to break out its Realized Price (the value of all the coins at the price that were bought divided by the amount of BTC that is in circulation) of 21.5k. In the case of traditional assets, amid continued economic uncertainty, the S&P ended up -4.2% for the month after mainly Fed Chair Jerome Powell’s Jackson Hole statements towards a more restrictive monetary policy . This was the weakest August in 7 years in the stock market mostly with concerns regarding further interest rate hikes by the Fed as discussed. On the other hand, Nasdaq was -4.6% . US Bonds (safe haven) and Gold were also both down, -5.4% and -3.1%, respectively. In terms of YTD returns, the markets evidence negative returns across the board. The S&P is -17%, Nasdaq -25.6%, BTC is -57%, ETH -55% and Bonds and Gold as well -15% and -5.6%, respectively. On the other hand, Teks alpha is -5.2% with much lower volatility. September is historically the worst month for BTC averaging a 5% decline since 2011 with only 2 positive returns since 2014 (2015 and 2016). ETH also has a poor track during this month, marking a 6% average decline since 2016. Our investment models do not rely just on seasonals or historical price variations, however it's worth noting that we are not entering into a historical bullish month and we are facing lots of macroeconomic risks ahead. As we said in prior newsletters, several challenges lie ahead for both traditional and digital assets. Volatility with large up/down price movements will continue as long as the macro remains fragile: FED rates hike, FED QT, China COVID restrictions, Taiwan issues, Europe's energy crisis and the endless Ukraine-Russia war. Although traditional markets are expecting a bearish pattern price movement like 2008 to be repeated, a breakout in the 200MA will squeeze all the shorts and could lead to a full equities recovery for the year.Performance
During the difficult month of August, the Fund returned -1.6%. Our long deltas affected the overall performance at the end of the month while our delta neutral strategies captured enough profits to mitigate losses. In addition to Teks Trend which was launched last month, we have also launched EER (Ethereum Enhanced Returns), which provides upside exposure to Ethereum but limits its losses. Looking forward, we are still expecting volatile months ahead. Given September ‘s negative seasonal plus all the macro news pending to be released (FOMC, Inflation,etc.) we are going to be extra cautious in adding long exposure on top of our current positions. It is very difficult to anticipate the market's price action in the coming weeks given all the financial and political uncertainties as expressed above. We will therefore use caution as we manage the portfolio.Teks Alpha Performance (%)
| JAN | FEB | MAR | APR | MAY | JUN | JUL | AUG | SEP | OCT | NOV | DEC | YTD | |
|---|---|---|---|---|---|---|---|---|---|---|---|---|---|
| 2021 | — | — | 1.36 | 0.79 | 0.77 | 0.80 | 1.51 | 1.61 | 1.15 | 2.56 | 1.70 | — | 12.9 |
| 2022 | -0.65 | 1.22 | 1.22 | -0.10 | -1.85 | -5.7 | 2.35 | -1.61 | — | — | — | — | -5.2 |
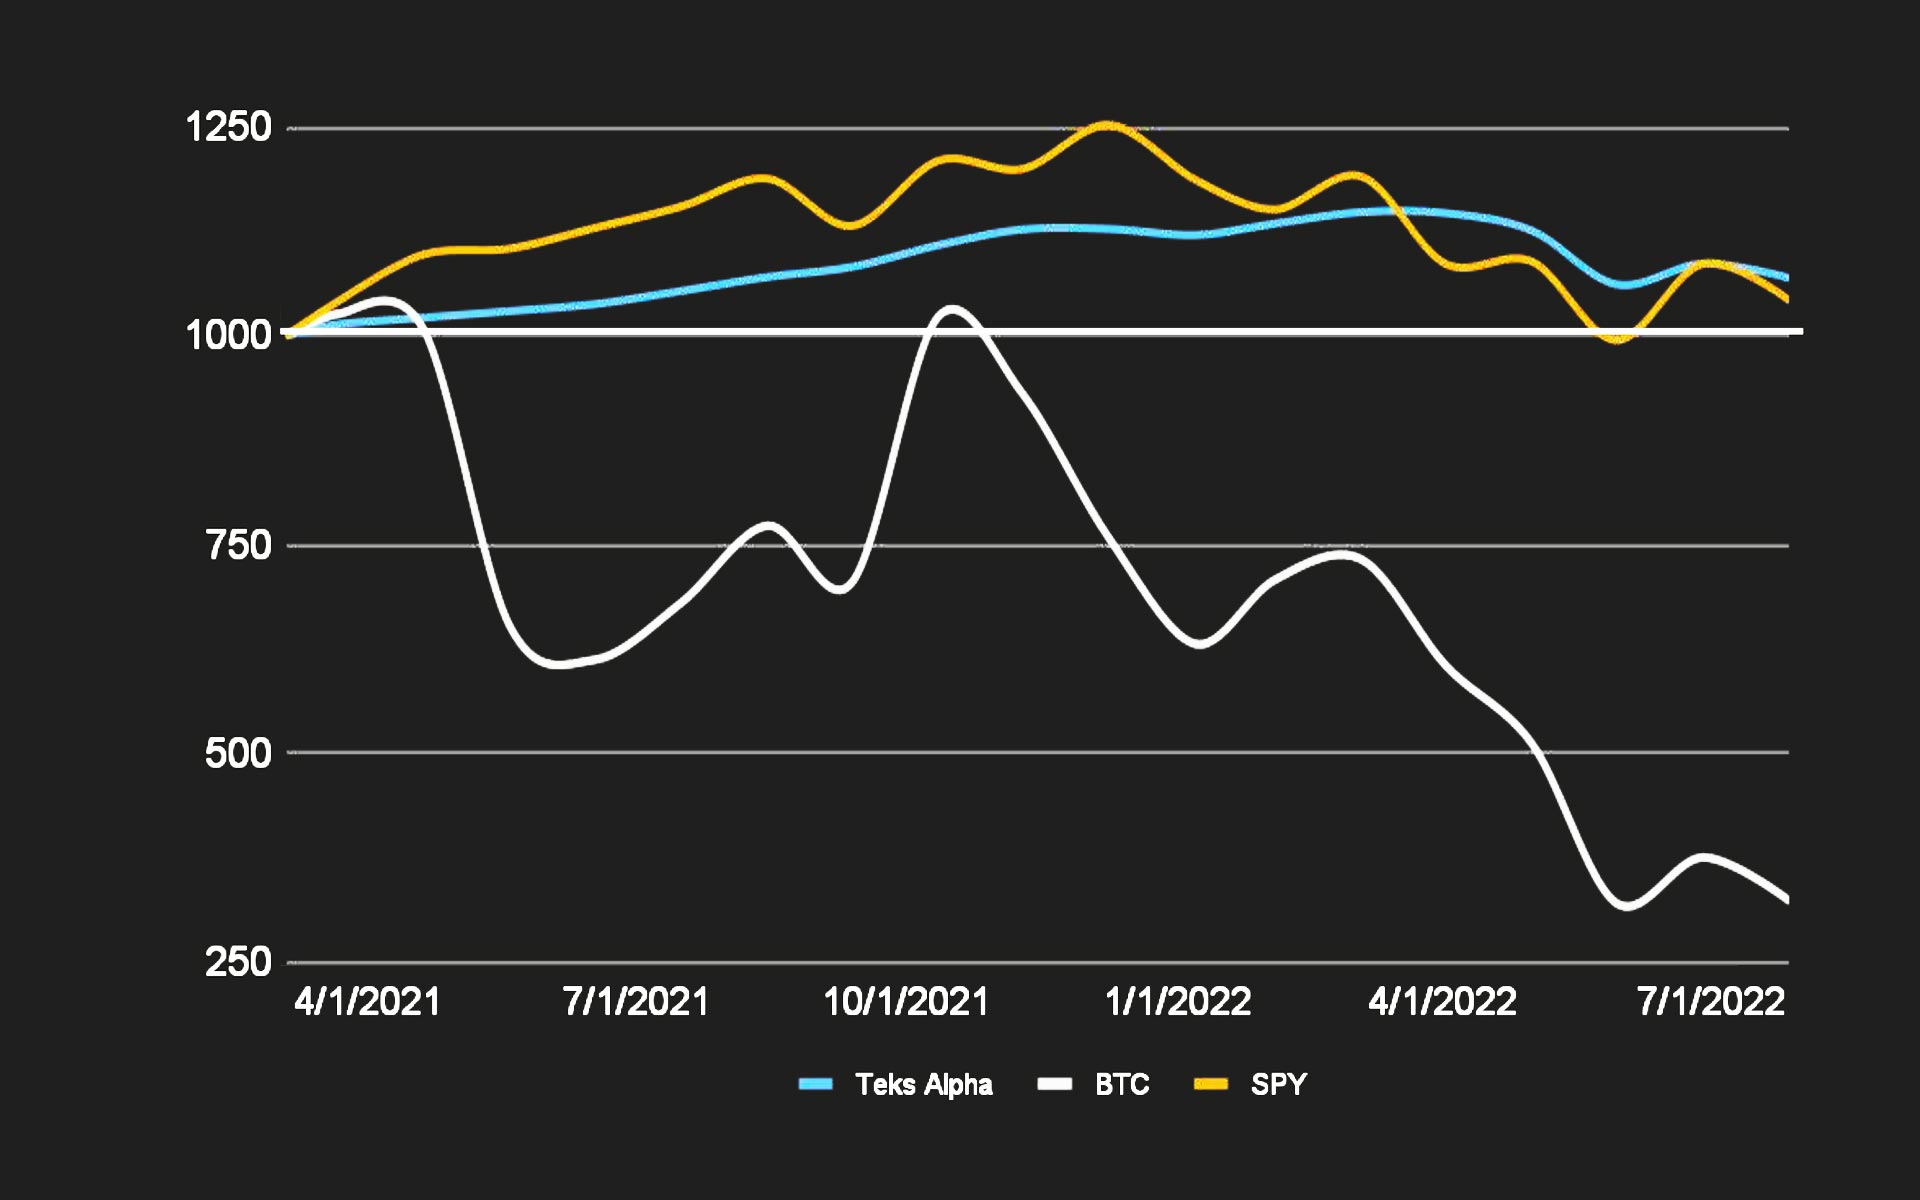
Teks Alpha Performance vs Benchmarks since inception (March 2021)
| TEKS A | BTC | SPY | |
|---|---|---|---|
| Effective | 6.90% | -67.74% | 4.19% |
| Annualized | 4.69% | -46.04% | 2.85% |
| STD Dev | 6.68% | 68.85% | 17.90% |
| Shape Ratio | 0.33 | -0.71 | 0.02 |